Go to Top Go to Bottom
Anim Biosci > Volume 37(6); 2024 > Article
Kaewtapee and Mosenthin: Predicting standardized ileal digestibility of lysine in full-fat soybeans using chemical composition and physical characteristics

Abstract

Objective

The present work was conducted to evaluate suitable variables and develop prediction equations using chemical composition and physical characteristics for estimating standardized ileal digestibility (SID) of lysine (Lys) in full-fat soybeans (FFSB).

Methods

The chemical composition and physical characteristics were determined including trypsin inhibitor activity (TIA), urease activity (UA), protein solubility in 0.2% potassium hydroxide (KOH), protein dispersibility index (PDI), lysine to crude protein ratio (Lys:CP), reactive Lys:CP ratio, neutral detergent fiber, neutral detergent insoluble nitrogen (NDIN), acid detergent insoluble nitrogen (ADIN), acid detergent fiber, L* (lightness), and a* (redness). Pearson’s correlation (r) was computed, and the relationship between variables was determined by linear or quadratic regression. Stepwise multiple regression was performed to develop prediction equations for SID of Lys.

Results

Negative correlations (p<0.01) between SID of Lys and protein quality indicators were observed for TIA (r = −0.80), PDI (r = −0.80), and UA (r = −0.76). The SID of Lys also showed a quadratic response (p<0.01) to UA, NDIN, TIA, L*, KOH, a* and Lys:CP. The best-fit model for predicting SID of Lys in FFSB included TIA, UA, NDIN, and ADIN, resulting in the highest coefficient of determination (R2 = 0.94).

Conclusion

Quadratic regression with one variable indicated the high accuracy for UA, NDIN, TIA, and PDI. The multiple linear regression including TIA, UA, NDIN, and ADIN is an alternative model used to predict SID of Lys in FFSB to improve the accuracy. Therefore, multiple indicators are warranted to assess either insufficient or excessive heat treatment accurately, which can be employed by the feed industry as measures for quality control purposes to predict SID of Lys in FFSB.

INTRODUCTION

Full-fat soybeans (FFSB) are an excellent source of protein and energy in pig diets [1]. However, the presence of heat-labile trypsin inhibitors in FFSB may cause a reduction in biological activity of trypsin, resulting in lower amino acid (AA) digestibility [2]. Currently, heat treatment of FFSB is being used to inactivate trypsin inhibitor activity (TIA) aiming to improve standardized ileal digestibility (SID) of crude protein (CP) and AA in piglets [2] and growing pigs [3]. However, excessive heat treatment may result in lower SID of AA in FFSB [3] due to destruction of chemical structure in AA and formation of Maillard reaction products [4]. Therefore, variation in protein quality of FFSB may be a result of either insufficient or excessive heat treatment.
The most commonly used indicators to assess differences in treatment of soybean products include urease activity (UA), protein solubility in 0.2% potassium hydroxide (KOH) and protein dispersibility index (PDI). These measurements are less expensive and more convenience in practice when compared with TIA [5]. Urease activity was in association with TIA as both enzymes were deactivated during heat treatment [5]. Alternatively, PDI and KOH can be used to reflect the solubility of protein fraction in response to the variation in heat processing [5]. Increasing heat treatment of soybean products showed lower ratios of lysine (Lys) to CP (Lys:CP) and reactive Lys (rLys) to CP (rLys:CP; [6]), and greater brown color [7]. Interestingly, increasing heat treatment also increased neutral detergent insoluble nitrogen (NDIN) content in FFSB [3], which may be used as an alternative variable to include in the prediction model for the extent of heat damage on SID of Lys. In the feed industry, there are several chemical and physical variables in place for quality control purposes. However, comparative studies aiming to assess the suitability of the individual variables including TIA, UA, PDI, KOH, Lys:CP, rLys:CP, neutral detergent fiber (NDF), NDIN, acid detergent insoluble nitrogen (ADIN), acid detergent fiber (ADF), and color values are lacking. The development of a prediction model can be used to evaluate soybean quality more efficiently, reducing time consumption. Thus, the objective of the present study was to evaluate suitable variables and develop prediction equations using chemical composition and physical characteristics for estimating SID of Lys of FFSB in growing pigs.

MATERIALS AND METHODS

Data of previously published work [3] including information on SID of Lys, NDIN, TIA, UA, PDI, KOH, Lys:CP, rLys:CP, NDF, ADF, L*, and a* were used. The ratio of reactive Lys to Lys (rLys:Lys) and ADIN were used as the additional parameters to include in the model.

Heat processing

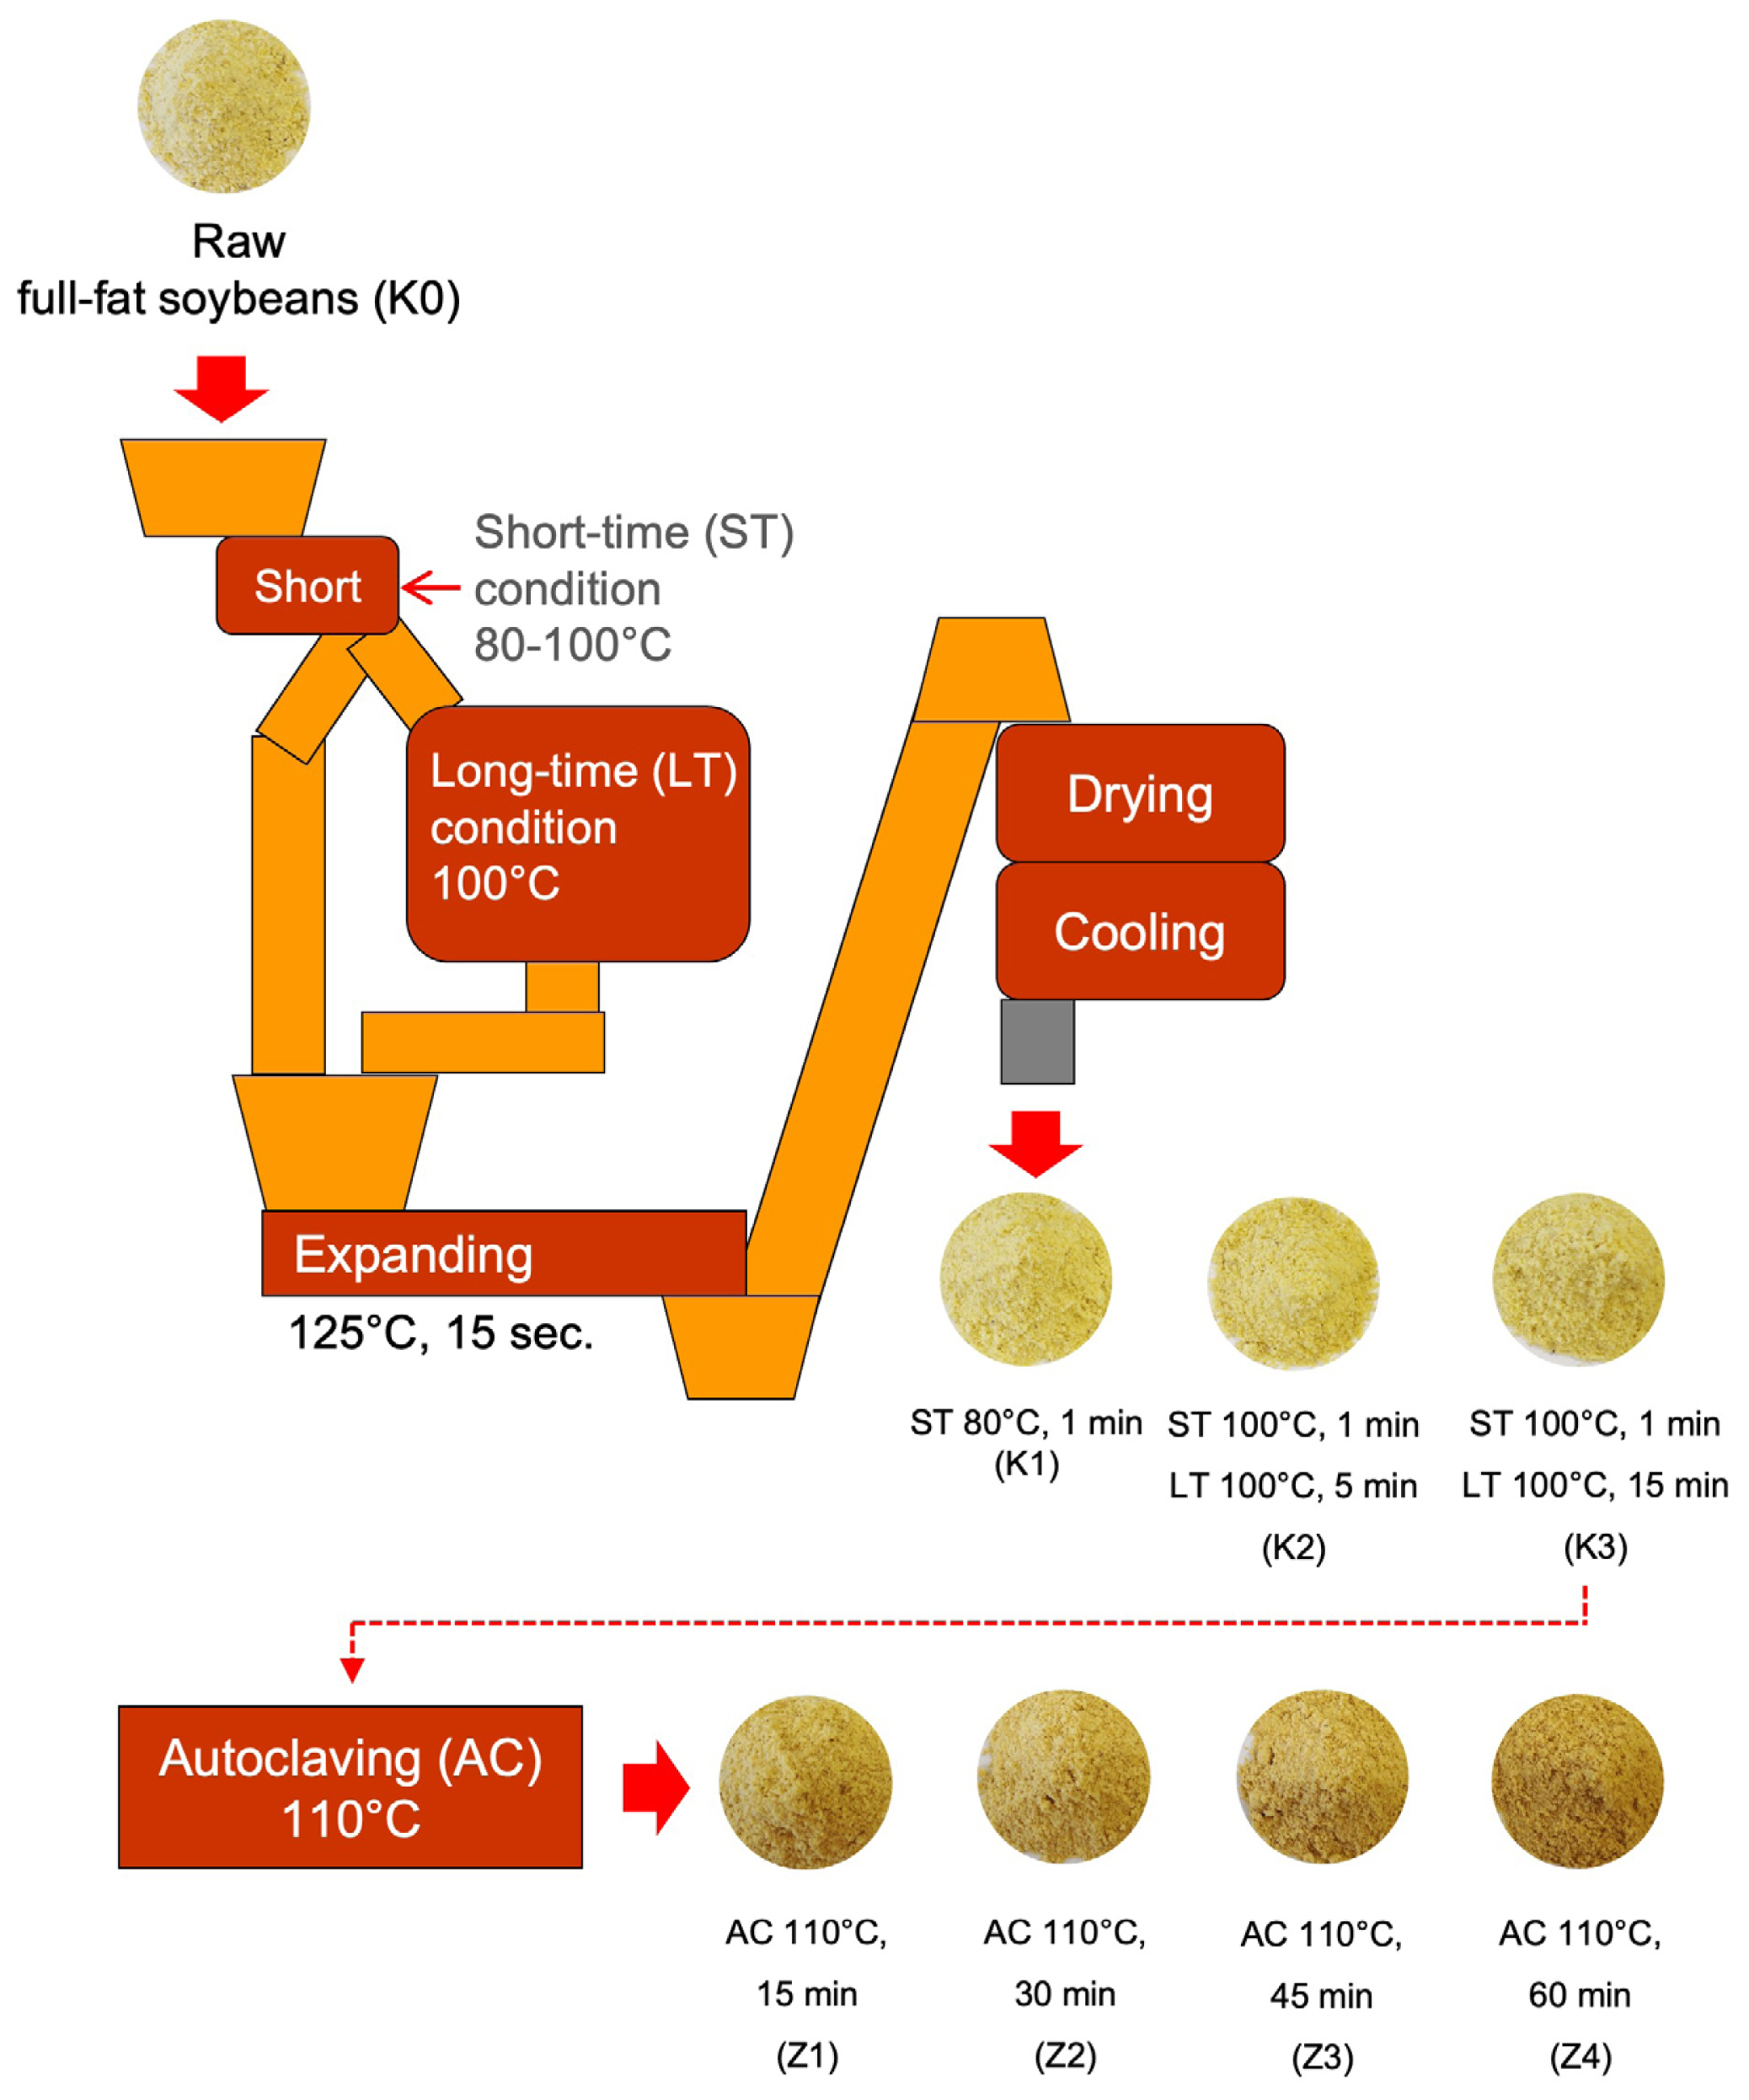
One batch of raw FFSB (K0) was mechanically broken and further processed using humidity conditions of wet heating procedure and autoclaving. The K0 was applied for short-time wet heating at 80°C for 1 min, followed by expansion at 125°C for 15 s to manufacture K1. Another 2 batches of K0 were processed using short-time wet heating at 100°C for 1 min, and thereafter long-time wet heating at 100°C for 5 min (K2) or 15 min (K3). These batches were expanded at 125°C for 15 s, followed by drying for 5 min and cooling for 5 min, respectively. The additional heat treatment of K3 was accomplished using autoclaving at 110°C for 15 (Z1), 30 (Z2), 45 (Z3), or 60 (Z4) min (Figure 1). In total, eight batches of FFSB with different heat treatment conditions were obtained from all of these processes. The chemical composition and soybean quality index of FFSB with different heat treatment conditions is shown in Table 1.

Chemical analyses

Chemical composition of differently heated FFSB was analyzed according to official methods [8]. The NDIN and ADIN were analyzed as described by Haese et al [9]. The gas combustion (FP-2000, Leco Corp., St Joseph, MI, USA) was used to analyze nitrogen (N) content according to method 990.03 of the AOAC International [10]. Crude protein was calculated by multiplying the content of N by 6.25. Lysine content was determined using ion-exchange chromatography [11]. Reactive lysine was determined as outlined by Fontaine et al [6]. Briefly, 0.6 mol/L of O-methylisourea was used to react undamaged protein-bound lysine in FFSB to yield homoarginine. The condition was optimal at pH 11.5 for 48 h, followed by hydrolysis with 9 mol/L HCl for 23 h at 110°C. Homoarginine was determined using ion-exchange chromatography with postcolumn derivatization and then converted to rLys by the following equation:
rLys (%)=(homoarginine (%)/molecular weight of homoarginine)×molecular weight of Lys
where molecular weight of homoarginine is 188.23 g/mol and molecular weight of Lys is 146.19 g/mol. The TIA was analyzed following method 71-10 [12]. The KOH solubility was determined as described by Araba and Dale [13]. The determination of UA was based on the procedure of ISO 5506:1988 [14], whereas PDI was performed as outlined by AOCS [15]. The color of FFSB was measured as L* (lightness) and a* (redness) values using a Chroma Meter (Model CR-100; Minolta Camera Co., Ltd., Osaka, Japan).

Statistical analysis

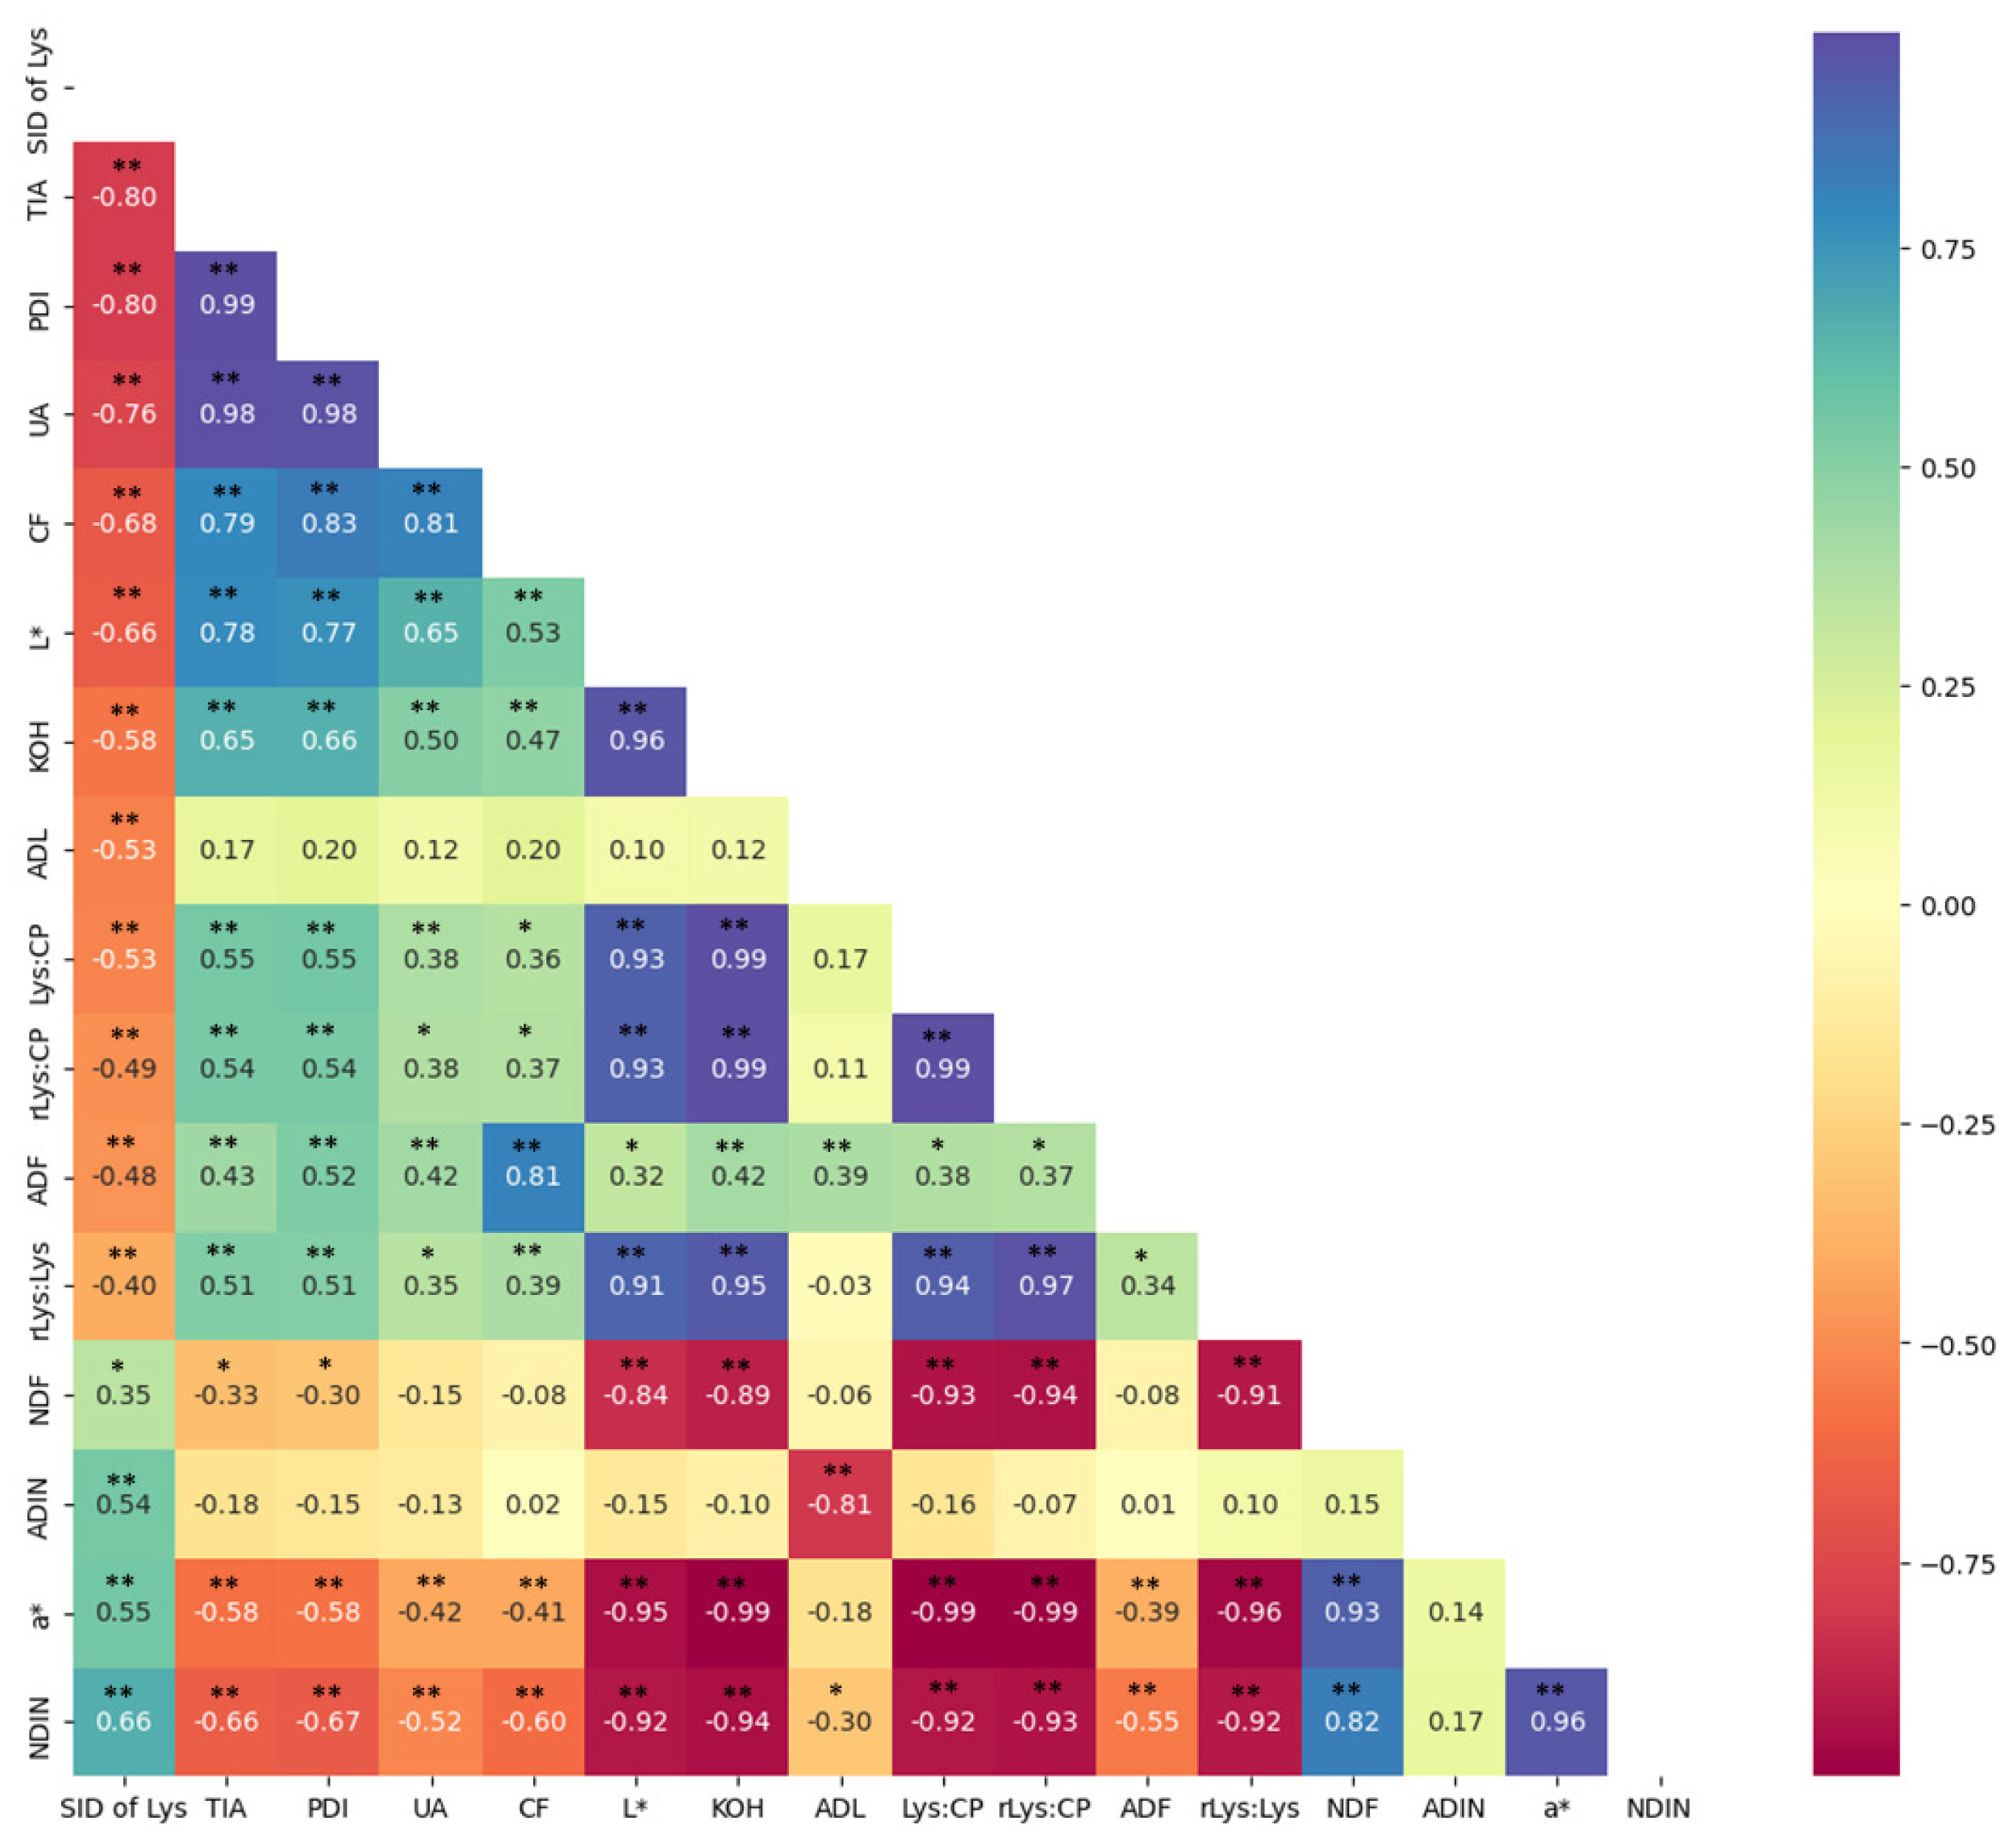
Pearson’s correlation (r) was computed using the CORR procedure of SAS (SAS Inst. Inc., Cary, NC, USA). Heatmap was created using library Seaborn [16] in python on Google Colab (Google Colaboratory, Mountain View, CA, USA). The relationship between SID of Lys and TIA, UA, KOH, PDI, Lys:CP, rLys:CP, rLys:Lys, crude fiber (CF), NDF, ADF, NDIN, ADIN, L*, and a* was determined by linear or quadratic regression using the general linear model (GLM) procedure of SAS. Stepwise multiple regression was performed to develop prediction equations for SID of Lys using the GLM procedure of SAS. Therefore, the prediction models included the following regression equations:
Linear regression: y=β0+β1x1Quadratic regression: y=β0+β1x1+β2x12Multiple linear regression: y=β0+β1x1+β2x2++βnxn
where y is the SID of Lys, β is a rate constant, and x is a variable. The R2 and root mean square error (RMSE) computed as
R2=1-Σ(yi-y^)2Σ(yi-y¯)2         RMSE=Σ(yi-y^)n
where yi is the observed value, ŷ is the estimated value, ȳ is mean, and n is the number of observations. The high R2 and low RMSE were used as criteria for the most accurate model to predict SID of Lys. A p-value of <0.05 was considered significantly different.

RESULTS

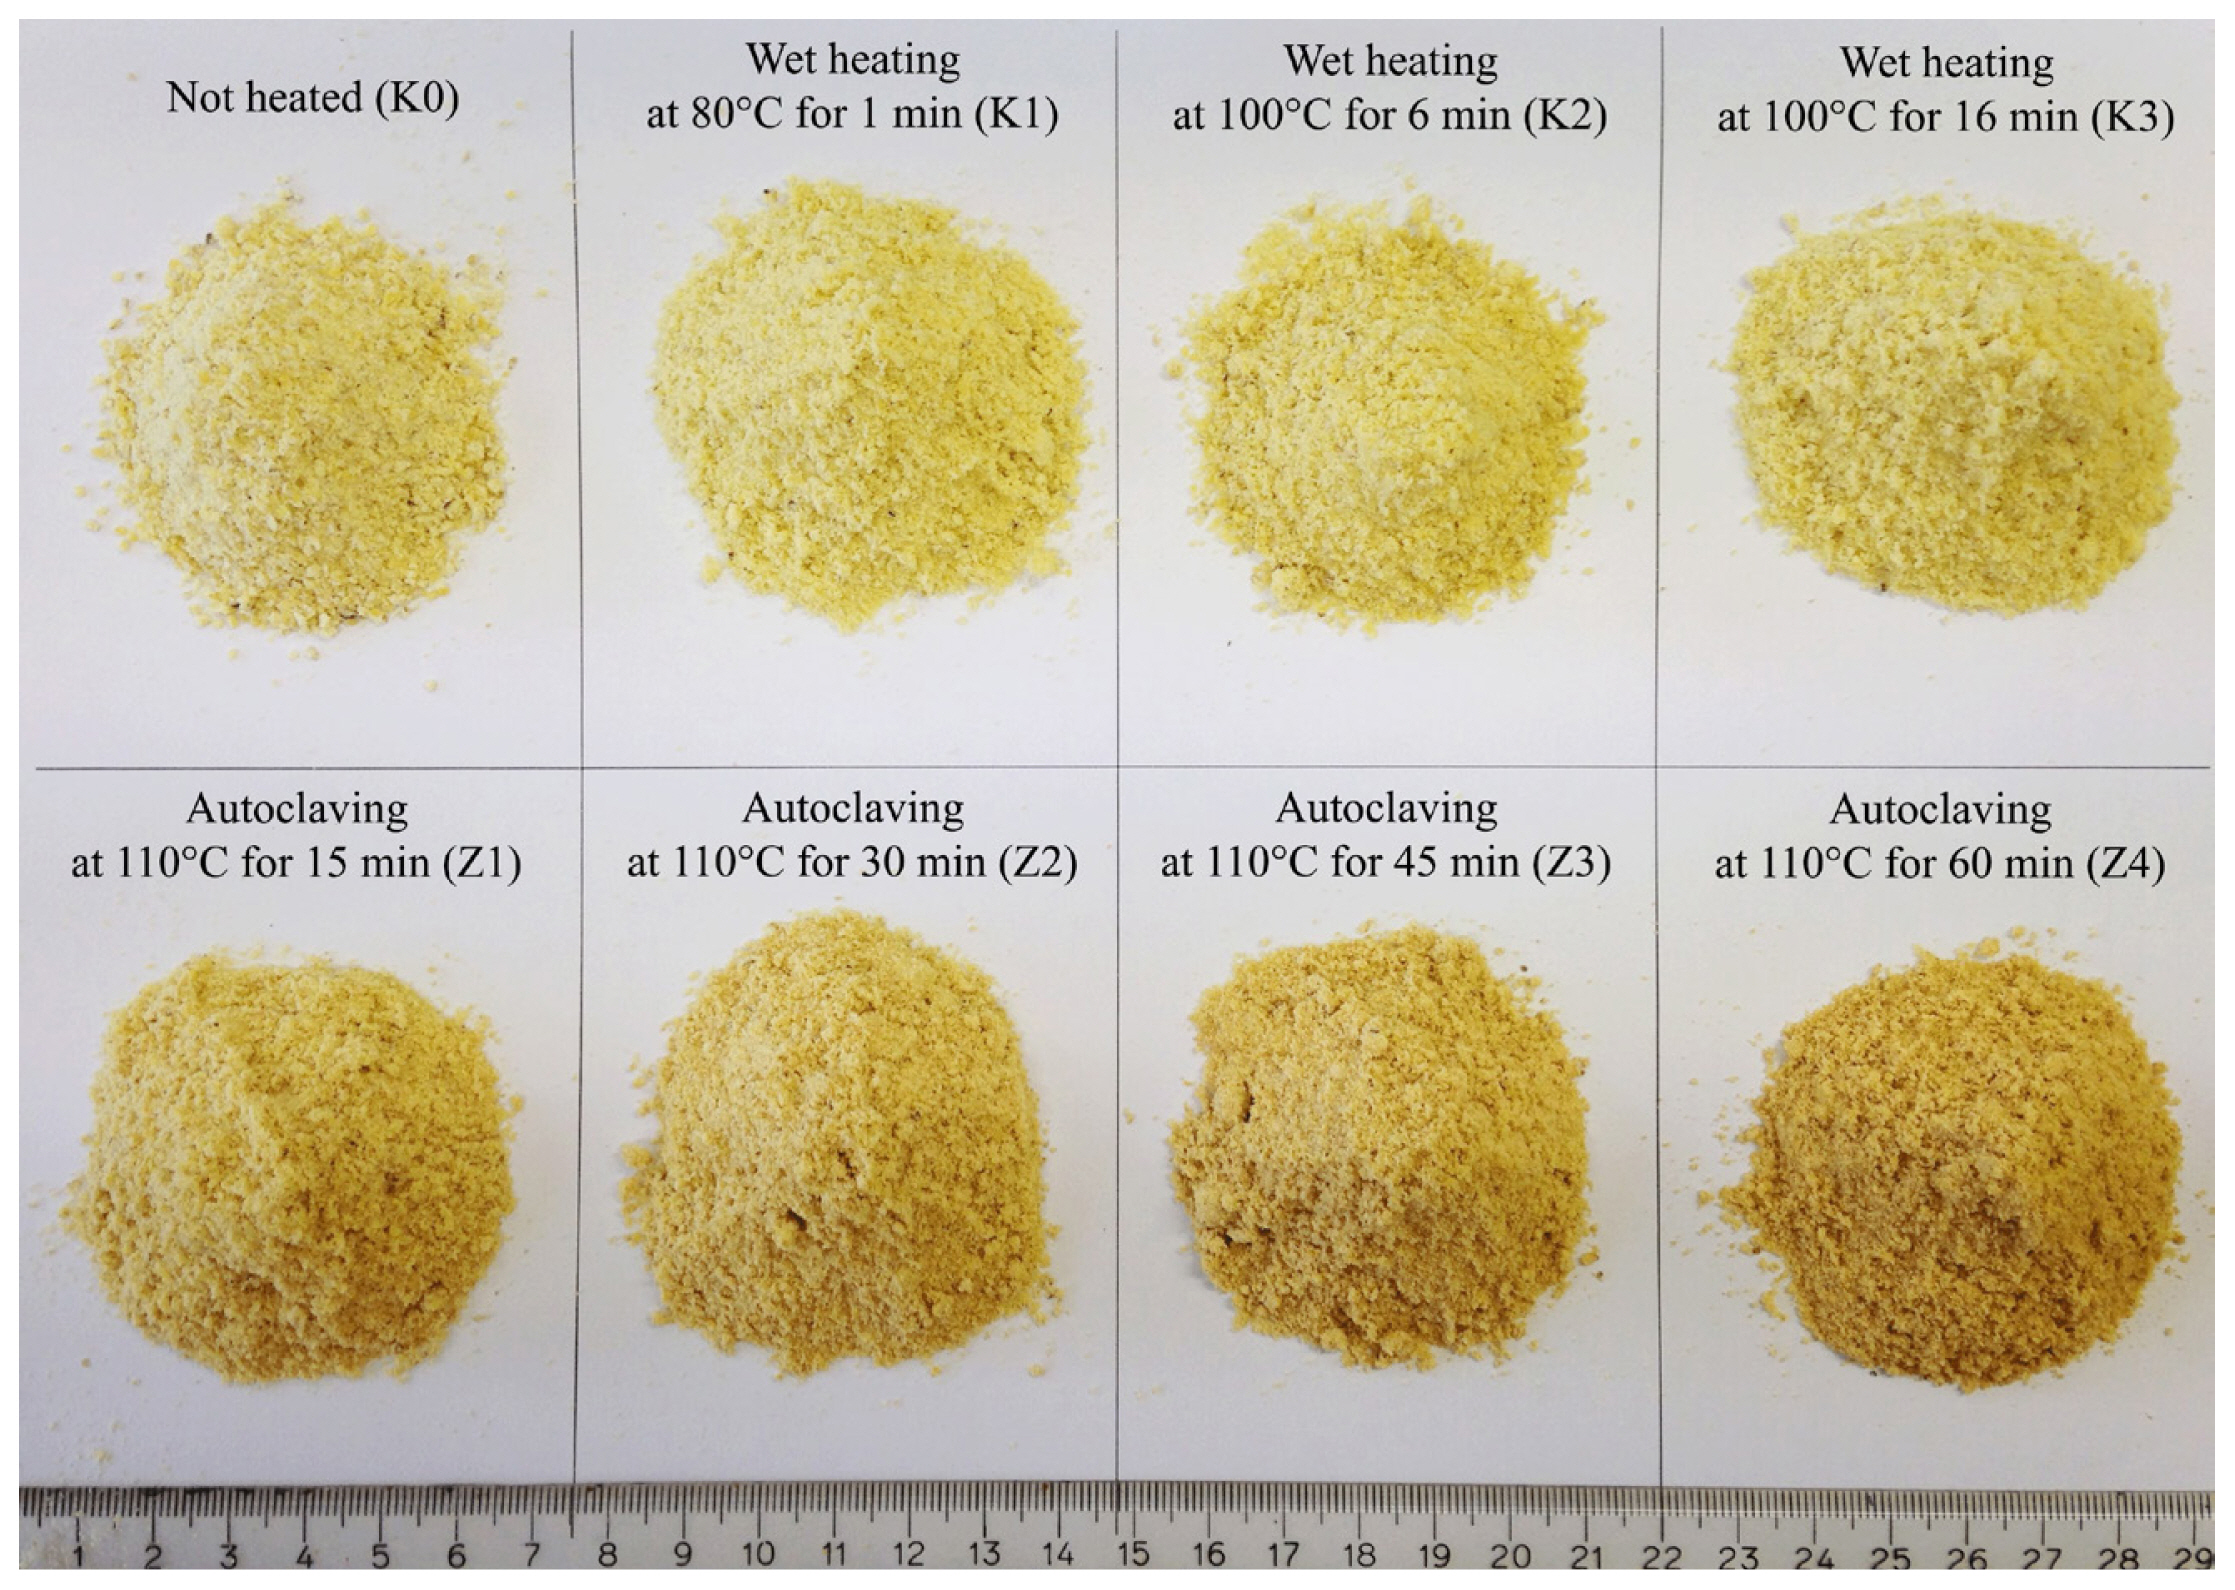
The effect of heat processing on the change color of FFSB is displayed in Figure 2. Correlation analysis between SID of Lys and chemical composition and physical characteristics of FFSB is shown in Figure 3. High negative correlations (p<0.01) between SID of Lys and protein quality indicators were observed for TIA (r = −0.80), PDI (r = −0.80), and urease (r = −0.76). In addition, negative correlations (p<0.01) between SID Lys and chemical composition and physical characteristics were observed for CF (r = −0.68) and L* (r = −0.66). In contrast, positive correlations (p<0.01) between SID of Lys and chemical composition and physical characteristics for NDIN (r = 0.66), a* (r = 0.55), and ADIN (r = 0.54).
The equations for predicting SID of Lys from individual variables are shown in Table 2. The SID of Lys also showed a quadratic increase (p<0.01) to lower UA, TIA, KOH, Lys:CP, and L*, and greater NDIN, a*, and ADF. The SID of Lys linearly decreased (p<0.01) with greater PDI, CF, rLys:CP, and rLys:Lys, In addition, the SID of Lys linearly increased (p<0.01) with greater ADIN. The highest coefficient of determination (R2) and lowest RMSE were observed for UA.
An improvement in the precision of prediction equations can be obtained by using stepwise regressions (Table 3). The best-fit model included TIA, UA, NDIN, and ADIN, resulting in the highest coefficient of determination (R2 = 0.94) and the lowest error measurement (RMSE = 4.38) for predicting SID of Lys. Likewise, multiple linear regression including TIA, UA, NDIN, and ADIN increased the accuracy of the prediction model for most AA.

DISCUSSION

The TIA in FFSB is responsible for negative effects on growth performance of pigs [17,18] due to the formation of inactive complexes with trypsin, chymotrypsin and other pancreatic enzymes [19]. Given this disadvantage, heat treatment has been used to reduce TIA in FFSB [20,21], which, in turn, resulted in higher SID of AA [3] and improved growth performance of pigs [22]. However, overheating may induce Maillard reaction products by increasing protein cross-links, which makes these products less soluble and less susceptible to digestive enzyme [23,24], thereby decreasing SID of AA in soybean products [7,25]. Results of the present study are in agreement with previous data, where high negative correlation was observed between SID of Lys and TIA. Furthermore, increasing heat treatment showed a quadratic response of greater SID of Lys to lower TIA. Notably, the lowest TIA in FFSB did not correspond to highest SID of Lys due to excessive heat damage, which was indicated by lower accuracy of TIA (R2 = 0.76) when compared to UA (R2 = 0.86) and NDIN (R2 = 0.82).
In the feed industry, several chemical and physical methods including determination of UA, KOH, and PDI are widely used to determine the degree of heat damage of soybean products [5,25]. In the present study, SID of Lys showed a quadratic response to decreasing UA and KOH, and a linear decrease with increasing PDI. Urease activity had the higher R2 (0.86) with lower RMSE (6.45) compared to PDI (R2 = 0.71, RMSE = 9.05) and KOH (R2 = 0.68, RMSE = 9.71). It has to be emphasized that the observed decrease in UA was associated with a similar decline in TIA with increasing heat treatment [26], whereas low PDI and KOH values reflect the lower solubility of the protein fraction in response to the high heat processing [5,27]. Under practical conditions, the TIA analysis is more time-consuming and expensive in comparison to UA, KOH, and PDI determination. Among these parameters based on R2 and RMSE obtained in the present study, determining UA or PDI is cost effective approaches for predicting SID of Lys with high accuracy.
Excessive heat treatment may induce the ɛ-amino group to react with reducing sugars [28,29]. Among AA, Lys is most sensitive to heat damage, consequently, the destruction of Lys is reflected in lower Lys:CP and rLys:CP [6]. In the present study, the SID of Lys showed a quadratic response with decreasing Lys:CP, and a linear increase with decreasing rLys:CP and rLys:Lys. Furthermore, the reducing sugars in fiber fractions represent the most reactive carbohydrate fraction during Maillard reaction [30]. According to Pastuszewska et al [31] and Eklund et al [32], prolongation of heat treatment of rapeseed products resulted in higher NDF and NDIN contents due to the formation of Maillard reaction products between protein and NDF during the intensify of heat treatment. In the present study, the SID of Lys showed a linear increase with increasing NDF, and a quadratic response with increasing NDIN. Increasing heat treatment of raw FFSB resulted in higher NDF and NDIN contents, whereas the SID of Lys increased from the under-heating to optimal heat processing condition due to the lower TIA. Thereafter, further heat treatment resulted in lower SID of Lys due to the greater formation of Maillard reaction products. Considering all the parameters within this group, the reliability of NDIN as a variable for predicting the SID of Lys in heat-treated protein supplements is notable due to the high accuracy of the prediction model.
The development of brown color in FFSB has been proposed to indicate the presence of Maillard reaction products [6]. These changes in color have been reported to coincide with changes in SID of Lys in soybean meal [7] and canola meal [33]. For example, a decrease in SID of CP and AA has been associated with darker and redder colors (lower L* and greater a* values) due to a greater presence of Maillard reaction products [7]. This is in accordance with the results of the present study, where SID of Lys showed a quadratic response to lower L* and greater a* values. Compared to chemical analyses of variables, color measurements represent a rapid method for predicting SID of Lys in pigs.
In comparison to individual variables, multiple linear regression including TIA, UA, NDIN and ADIN increased the accuracy (R2 = 0.93 to 0.96) of the prediction model with low error measurement (RMSE = 3.96 to 5.35) for most AA. Possibly, TIA represents the anti-nutritional factors in soybean products [17]. Furthermore, UA in soybean products will be completely destroyed, thus, there is no further response to additional heat treatment. On the other hand, prolonged heat treatment leads to increased contents of NDIN. Consequently, NDIN serve as reliable indicators of the extent of heat treatment, while UA primarily reflects the presence of anti-nutritional factors, similar to TIA. Therefore, a multiple linear regression including TIA, UA, NDIN, and ADIN was the best fit model for predicting SID of most AA in soybean products.

CONCLUSION

The TIA, PDI, and UA were suitable common indicators of soybean quality related to SID of Lys due to high negative correlation. For the prediction model, the quadratic regression with one variable indicated the four highest coefficients of determination for UA (R2 = 0.86), NDIN (R2 = 0.82), TIA (R2 = 0.76), and PDI (R2 = 0.71). The multiple linear regression including several variables is an alternative model used to predict SID of all AA in FFSB. In conclusion, multiple indicators are warranted to assess either insufficient or excessive heat treatment accurately, which can be employed as measures for quality control purposes to predict SID of Lys in FFSB.

Notes

CONFLICT OF INTEREST

We certify that there is no conflict of interest with any financial organization regarding the material discussed in the manuscript.

FUNDING

This work was financially supported by the Office of the Ministry of Higher Education, Science, Research and Innovation; and the Thailand Science Research and Innovation through the Kasetsart University Reinventing University Program 2021.

Figure 1
Flow chart of heat treatment of full-fat soybeans.
ab-23-0236f1.jpg
Figure 2
Full-fat soybeans at different heat treatment conditions.
ab-23-0236f2.jpg
Figure 3
Pearson’s correlation between standardized ileal digestibility of lysine (SID of Lys) and chemical and physical characteristics of full-fat soybeans. ADF, acid detergent fiber; ADIN, acid detergent insoluble nitrogen; a*, redness; CF, crude fiber; KOH, protein solubility in 0.2% potassium hydroxide; Lys:CP, lysine to crude protein ratio; L*, lightness; NDF, neutral detergent fiber; NDIN, neutral detergent insoluble nitrogen; PDI, protein dispersibility index; rLys:CP, reactive lysine; rLys:Lys, reactive lysine to lysine ratio; TIA, trypsin inhibitor activity; UA, urease activity. Significances: * p<0.05, ** p<0.01.
ab-23-0236f3.jpg
Table 1
Chemical composition and soybean quality index of full-fat soybeans with different heat treatment conditions
Item Raw FFSB Heat processing

Short-time condition Short-time condition


80°C 100°C 100°C 100°C


1 min 1 min 1 min 1 min


Long-time condition, 100°C Long-time condition, 100°C


5 min 15 min 15 min


Expanding, 125°C 5 s Expanding, 125°C 5 s

Autoclaving, 110°C

15 min 30 min 45 min 60 min


(K0) (K1) (K2) (K3) (Z1) (Z2) (Z3) (Z4)
SID of Lys (%) 47.56 57.44 78.04 83.97 83.76 83.88 84.96 82.03
Chemical composition (% DM)
 CP 39.23 39.41 39.41 39.45 39.81 40.15 39.71 40.22
 Lys 2.45 2.47 2.46 2.46 2.43 2.38 2.33 2.32
 rLys 2.26 2.28 2.28 2.28 2.21 2.16 2.09 2.05
 Lys:CP 6.24 6.28 6.24 6.24 6.11 5.92 5.86 5.77
 rLys:CP 5.76 5.78 5.78 5.79 5.56 5.38 5.27 5.10
 rLys:Lys 92.36 92.09 92.56 92.75 90.99 90.92 89.94 88.42
 CF 4.95 4.06 4.43 3.46 3.65 3.96 4.02 3.57
 NDF 10.76 8.97 10.65 8.65 10.82 11.95 13.09 14.37
 NDIN 0.10 0.10 0.20 0.40 0.70 0.60 0.90 1.10
 ADF 6.31 6.08 6.89 5.13 5.61 5.71 5.70 5.56
 ADIN 0.08 0.05 0.10 0.09 0.09 0.10 0.09 0.07
Soybean quality index
 TIA (TIU/g) 29.49 7.75 6.36 5.73 2.59 1.62 1.07 0.86
 UA (mg N2/g min) 4.48 0.45 0.39 0.05 0.02 0.01 0.00 0.00
 PDI (%) 72.20 22.00 24.60 14.70 9.80 7.50 7.00 6.80
 KOH (%) 94.20 90.00 89.50 88.70 81.40 71.80 66.90 60.30
 L* 65.27 62.34 60.68 62.42 59.38 57.97 56.54 54.56
 a* −0.88 −1.20 −0.57 −0.69 1.98 3.29 4.59 6.17

FFSB, full-fat soybeans; SID of Lys, standardized ileal digestibility of lysine; CP, crude protein; Lys, lysine; rLys, reactive lysine; Lys:CP, lysine to crude protein ratio; rLys:CP, reactive lysine to crude protein ratio; rLys:Lys, reactive lysine to lysine ratio; CF, crude fiber; NDF, neutral detergent fiber; NDIN, neutral detergent insoluble nitrogen; ADF, acid detergent fiber; ADIN, acid detergent insoluble nitrogen; TIA, trypsin inhibitor activity; TIU, trypsin inhibitor units; UA, urease activity; PDI, protein dispersibility index; KOH, protein solubility in 0.2% potassium hydroxide; L*, lightness; a*, redness.

Table 2
Linear and quadratic regression equations for standardized ileal digestibility of lysine (SID of Lys) from single variable in full-fat soybeans1)
No Variable Equation R2 RMSE p-value

Linear Quadratic
1. UA SID of Lys = 84.64−46.94(UA)+8.63(UA2) 0.86 6.45 <0.001 <0.001
2. NDIN SID of Lys = 47.78+107.14(NDIN)−71.22(NDIN)2 0.82 7.38 <0.001 <0.001
3. TIA SID of Lys = 88.45−2.79(TIA)+0.05(TIA)2 0.76 8.35 <0.001 <0.001
4. PDI SID of Lys = 86.91−0.58(PDI) 0.71 9.05 0.001 0.060
5. L* SID of Lys = −1,776.72+65.12(L*)−0.57(L*)2 0.70 9.36 <0.001 <0.001
6. KOH SID of Lys = −296.25+10.63(KOH)−0.07(KOH)2 0.68 9.71 <0.001 <0.001
7. a* SID of Lys = 73.46+7.46(a*)−1.03(a*)2 0.54 11.60 <0.001 0.003
8. CF SID 0f Lys = 162.03−21.66(CF) 0.53 11.55 <0.001 0.055
9. Lys:CP SID of Lys = −8,053.60+2,735.68(Lys:CP) −229.82(Lys:CP)2 0.50 12.19 0.008 0.007
10. ADF SID of Lys = 738.22−208.56(ADF)+16.18(ADF)2 0.40 13.25 0.007 0.011
11. ADIN SID of Lys = 35.24+485.26(ADIN) 0.37 13.47 <0.001 0.805
12. rLys:CP SID of Lys = 224.49−26.83(rLys:CP) 0.33 13.85 0.001 0.086
13. rLys:Lys SID of Lys = 440.85−4.00(rLys:Lys) 0.25 14.68 0.006 0.444
14. NDF SID of Lys = 46.10+2.65(NDF) 0.20 15.10 0.018 0.573

RMSE, root mean square error; UA, urease activity; NDIN, neutral detergent insoluble nitrogen; TIA, trypsin inhibitor activity; PDI, protein dispersibility index; L*, lightness; KOH, protein solubility in 0.2% potassium hydroxide; a*, redness; a*, redness; CF, crude fiber; Lys:CP, lysine to crude protein ratio; ADF, acid detergent fiber; ADIN, acid detergent insoluble nitrogen; rLys:CP, reactive lysine to crude protein ratio; rLys:Lys, reactive lysine to lysine ratio; NDF, neutral detergent fiber.

1) There are 46 observations for the linear and quadratic regression equations.

Table 3
Stepwise regression equations for standardized ileal digestibility (SID) of amino acids
Item Equation R2 RMSE
Indispensable amino acids
 Arginine (Arg) SID of Arg = 64.71−5.61(CF)+16.33(NDIN)−3.41(UA)+394.26(ADIN) 0.95 4.17
 Histidine (His) SID of His = 23.30+2.23(TIA)+26.81(NDIN)−16.52(UA)+413.33(ADIN) 0.94 4.19
 Isoleucine (Ile) SID of Ile = 55.75−7.53(CF)+19.83(NDIN)−3.90(UA)+476.27(ADIN) 0.96 4.36
 Leucine (Leu) SID of Leu = 7.31+2.60(TIA)+35.94(NDIN)−19.24(UA)+502.12(ADIN) 0.96 4.34
 Lysine (Lys) SID of Lys = 23.91+2.47(TIA)−18.85(UA)+24.55(NDIN)+409.67(ADIN) 0.94 4.38
 Methionine (Met) SID of Met = 17.05+2.42(TIA)+31.66(NDIN) −18.10(UA)+442.55(ADIN) 0.94 4.86
 Phenylalanine (Phe) SID of Phe = 7.97+2.44(TIA)+34.23(NDIN)−18.60(UA)+507.24(ADIN) 0.96 4.41
 Threonine (Thr) SID of Thr = 29.06−2.46(a*)−0.32(PDI)+34.05(NDIN)+388.86(ADIN) 0.94 4.51
 Tryptophan (Trp) SID of Trp = 60.71−9.29(CF)−24(PDI)+17.25(NDIN)+501.81(ADIN) 0.96 4.27
 Valine (Val) SID of Val = 13.00+2.57(TIA)+32.65(NDIN)−18.67(UA)+446.10(ADIN) 0.96 3.96
Dispensable amino acids
 Alanine (Ala) SID of Ala = 34.87−2.28(a*)−0.33(PDI)+32.18(NDIN)+366.66(ADIN) 0.95 4.18
 Aspartic acid (Asp) SID of Asp = 81.22−11.60(CF) −0.63(TIA)+483.95(ADIN) 0.93 4.75
 Cystine (Cys) SID of Cys = 74.94−13.07(CF)−0.69(TIA)+550.51(ADIN) 0.93 5.35
 Glutamic acid (Glu) SID of Glu = 26.26+1.87(TIA)+24.75(NDIN)−14.60(UA)+403.01(ADIN) 0.93 4.82
 Glycine (Gly) SID of Gly = 30.89−2.55(a*)−0.32(PDI)+34.05(NDIN)+382.48(ADIN) 0.94 4.52
 Proline (Pro) SID of Pro = 23.79+2.12(TIA)+28.98(NDIN)−16.27(UA)+496.40(ADIN) 0.93 5.28
 Serine (Ser) SID of Ser = 5.36+2.77(TIA)+34.47(NDIN)−20.33(UA)+508.92(ADIN) 0.96 4.49

RMSE, root mean square error; CF, crude fiber; NDIN, neutral detergent insoluble nitrogen; UA, urease activity; ADIN, acid detergent insoluble nitrogen; ADL, acid detergent lignin; TIA, trypsin inhibitor activity; a*, redness; PDI, protein dispersibility index.

REFERENCES

1. Cervantes-Pahm SK, Stein HH. Effect of dietary soybean oil and soybean protein concentration on the concentration of digestible amino acids in soybean products fed to growing pigs. J Anim Sci 2008; 86:1841–9. https://doi.org/10.2527/jas.2007-0721
crossref pmid
2. Goebel KP, Stein HH. Ileal digestibility of amino acids in conventional and low-Kunitz soybean products fed to weanling pigs. Asian-Australas J Anim Sci 2011; 24:88–95. https://doi.org/10.5713/ajas.2011.90583
crossref
3. Kaewtapee C, Eklund M, Wiltafsky M, Piepho HP, Mosenthin R, Rosenfelder P. Influence of wet heating and autoclaving on chemical composition and standardized ileal crude protein and amino acid digestibility in full-fat soybeans for pigs. J Anim Sci 2017; 95:779–88. https://doi.org/10.2527/jas.2016.0932
crossref pmid
4. Pahm AA, Pedersen C, Stein HH. Application of the reactive lysine procedure to estimate lysine digestibility in distillers dried grains with solubles fed to growing pigs. J Agric Food Chem 2008; 56:9441–6. https://doi.org/10.1021/jf801618g
crossref pmid
5. Batal AB, Douglas MW, Engram AE, Parsons CM. Protein dispersibility index as an indicator of adequately processed soybean meal. Poult Sci 2000; 79:1592–6. https://doi.org/10.1093/ps/79.11.1592
crossref pmid
6. Fontaine J, Zimmer U, Moughan PJ, Rutherfurd SM. Effect of heat damage in an autoclave on the reactive lysine contents of soy products and corn distillers dried grains with solubles. Use of the results to check on lysine damage in common qualities of these ingredients. J Agric Food Chem 2007; 55:10737–43. https://doi.org/10.1021/jf071747c
crossref pmid
7. González-Vega JC, Kim BG, Htoo JK, Lemme A, Stein HH. Amino acid digestibility in heated soybean meal fed to growing pigs. J Anim Sci 2011; 89:3617–25. https://doi.org/10.2527/jas.2010-3465
crossref pmid
8. VDLUFA. Handbuch der Landwirtschaftlichen Versuchs-und Untersuchungsmethodik (VDLUFA-Methodenbuch), III Die chemische Untersuchung von Futtermitteln. Darmstadt, Germany: VDLUFA-Verlag; 2007.

9. Haese E, Titze N, Rodehutscord M. In situ ruminal disappearance of crude protein and phytate from differently processed rapeseed meals in dairy cows. J Sci Food Agric 2021; 102:2805–12. https://doi.org/10.1002/jsfa.11621
crossref pmid
10. AOAC. Official methods of analysis of AOAC. 18th edGaithersburg, MD, USA: AOAC International; 2000.

11. Llames CR, Fontaine J. Determination of amino acids in feeds: collaborative study. J AOAC Int 1994; 77:1362–402. https://doi.org/10.1093/jaoac/77.6.1362
crossref
12. AACC (American Association of Cereal Chemists). Approved method for trypsin inhibitor, method 71-10. 9th edSt. Paull, MN, USA: AACC; 1995.

13. Araba M, Dale NM. Evaluation of protein solubility as an indicator of overprocessing soybean meal. Poult Sci 1990; 69:76–83. https://doi.org/10.3382/ps.0690076
crossref
14. ISO 5506-1988. Soya bean products - Determination of urease activity. International Organization for Standardization. Geneva, Switzerland: ISO; 1988.
crossref
15. AOCS (American Oil Chemists’ Society). Protein dispersibility index (Official method ba 10-65). Champaign, IL, USA: AOCS; 1980.

16. Waskom ML. Seaborn: statistical data visualization. J Open Source Softw 2021; 6:3021 https://doi.org/10.21105/joss.03021
crossref
17. Herkelman KL, Cromwell GL, Stahly TS, Pfeiffer TW, Knabe DA. Apparent digestibility of amino acids in raw and heated conventional and low-trypsin-inhibitor soybeans for pigs. J Anim Sci 1992; 70:818–26. https://doi.org/10.2527/1992.703818x
crossref pmid
18. Zollitsch W, Wetscherek W, Lettner F. Use of differently processed full-fat soybeans in a diet for pig fattening. Anim Feed Sci Technol 1993; 41:237–46. https://doi.org/10.1016/0377-8401(93)90016-D
crossref
19. Yen JT, Jensen AH, Simon J. Effect of dietary raw soybean and soybean trypsin inhibitor on trypsin and chymotrypsin activities in the pancreas and in small intestinal juice of growing swine. J Nutr 1977; 107:156–65. https://doi.org/10.1093/jn/107.1.156
crossref pmid
20. Kaankuka FG, Balogun TF, Tegbe TSB. Effects of duration of cooking of full-fat soya beans on proximate analysis, levels of antinutritional factors, and digestibility by weanling pigs. Anim feed Sci Technol 1996; 62:229–37. https://doi.org/10.1016/S0377-8401(96)00952-2
crossref
21. Qin G, Elst ERT, Bosch MW, Poel AFB. Thermal processing of whole soya beans: Studies on the inactivation of antinutritional factors and effects on ileal digestibility in piglets. Anim Feed Sci Technol 1996; 57:313–24. https://doi.org/10.1016/0377-8401(95)00863-2
crossref
22. Palacios MF, Easter RA, Soltwedel KT, et al. Effect of soybean variety and processing on growth performance of young chicks and pigs. J Anim Sci 2004; 82:1108–14. https://doi.org/10.2527/2004.8241108x
crossref pmid
23. Hansen LP, Millington RJ. Blockage of protein enzymatic digestion (carboxypeptidase-B) by heat-induced sugar-lysine reactions. J Food Sci 1979; 44:1173–77. https://doi.org/10.1111/J.1365-2621.1979.TB03474.X
crossref
24. Öste R, Sjödin P. Effect of Maillard reaction products on protein digestion. In vivo studies on rats. J Nutr 1984; 114:2228–34. https://doi.org/10.1093/jn/114.12.2228
crossref pmid
25. Bruce KJ, Karr-Lilienthal LK, Zinn KE, et al. Evaluation of the inclusion of soybean oil and soybean processing by-products to soybean meal on nutrient composition and digestibility in swine and poultry. J Anim Sci 2006; 84:1403–14. https://doi.org/10.2527/2006.8461403x
crossref pmid
26. Wright KN. Soybean meal processing and quality control. J Am Oil Chem Soc 1981; 58:294–300. https://doi.org/10.1007/BF02582362
crossref
27. Parsons CM, Hashimoto K, Wedekind KJ, Baker DH. Soybean protein solubility in potassium hydroxide: an in vitro test of in vivo protein quality. J Anim Sci 1991; 69:2918–24. https://doi.org/10.2527/1991.6972918x
crossref pmid
28. Ledl F, Schleicher E. New aspects of the Maillard reaction in foods and in the human body. Angew Chem Int Ed 1990; 29:565–594. https://doi.org/10.1002/anie.199005653
crossref
29. Ames JM. The Maillard reaction. Hudson , editorBiochemistry of food proteins. London, UK: Elsevier Applied Science; 1992. p. 99–153.
crossref pmid
30. Goering HK, Van Soest PJ, Hemken RW. Relative susceptibility of forages to heat damage as affected by moisture, temperature, and pH. J Dairy Sci 1973; 56:137–143. https://doi.org/10.3168/jds.S0022-0302(73)85127-6
crossref
31. Pastuszewska B, Jabłecki G, Buraczewska L, et al. The protein value of differently processed rapeseed solvent meal and cake assessed by in vitro methods and in tests with rats. Anim Feed Sci Technol 2003; 106:175–88. https://doi.org/10.1016/S0377-8401(03)00005-1
crossref
32. Eklund M, Sauer N, Schöne F, et al. Effect of processing of rapeseed under defined conditions in a pilot plant on chemical composition and standardized ileal amino acid digestibility in rapeseed meal for pigs. J Anim Sci 2015; 93:2813–25. https://doi.org/10.2527/jas.2014-8210
crossref pmid
33. Almeida FN, Htoo JK, Thomson J, Stein HH. Effects of heat treatment on the apparent and standardized ileal digestibility of amino acids in canola meal fed to growing pigs. Anim Feed Sci Technol 2014; 187:44–52. https://doi.org/10.1016/j.anifeedsci.2013.09.009
crossref


Editorial Office
Asian-Australasian Association of Animal Production Societies(AAAP)
Room 708 Sammo Sporex, 23, Sillim-ro 59-gil, Gwanak-gu, Seoul 08776, Korea   
TEL : +82-2-888-6558    FAX : +82-2-888-6559   
E-mail : editor@animbiosci.org               

Copyright © 2024 by Asian-Australasian Association of Animal Production Societies.

Developed in M2PI

Close layer
prev next