Validation of selection accuracy for the total number of piglets born in Landrace pigs using genomic selection
Article information
Abstract
Objective
This study was to determine the relationship between estimated breeding value and phenotype information after farrowing when juvenile selection was made in candidate pigs without phenotype information.
Methods
After collecting phenotypic and genomic information for the total number of piglets born by Landrace pigs, selection accuracy between genomic breeding value estimates using genomic information and breeding value estimates of best linear unbiased prediction (BLUP) using conventional pedigree information were compared.
Results
Genetic standard deviation (σa) for the total number of piglets born was 0.91. Since the total number of piglets born for candidate pigs was unknown, the accuracy of the breeding value estimated from pedigree information was 0.080. When genomic information was used, the accuracy of the breeding value was 0.216. Assuming that the replacement rate of sows per year is 100% and generation interval is 1 year, genetic gain per year is 0.346 head when genomic information is used. It is 0.128 when BLUP is used.
Conclusion
Genetic gain estimated from single step best linear unbiased prediction (ssBLUP) method is by 2.7 times higher than that the one estimated from BLUP method, i.e., 270% more improvement in efficiency.
INTRODUCTION
As an efficient alternative to accelerate genetic improvement and improve the selection accuracy, genomic selection method using dense single nucleotide polymorphism (SNP) markers covering the whole genome [1,2] has been developed. Genomic selection was first proposed by Meuwissen et al [3]. Through high-density marker mapping, it can predict the genetic ability of individuals. It has been reported that genomic selection is more accurate than conventional breeding value estimation method. Especially when young animals whose phenotypic dada could not be obtained for breeding value estimation, highly accurate genomic selection can be used to make juvenile selection possible [2].
To predict genomic information of individuals without genomic information, Gengler et al [4] and VanRaden [5] have proposed algorithms to calculate genomic relationship matrix and the estimation method for obtaining genomic breeding value. Misztal et al [6] have also reported an algorithm to combine conventional pedigree information with genomic information. Recently, Liu et al [7] have developed SNP single step genomic model (SSSmodel) to estimate SNP effect directly. This model have been applied to animals in Germany and Canada for genetic evaluations.
For average daily gain and feed conversion ratio of Duroc pigs in Denmark, accuracy rates of genetic estimation have been compared among best linear unbiased prediction (BLUP) method (uses pedigree and performance test information for estimation), genomic best linear unbiased prediction (GBLUP) method (uses only genomic information of individual pigs for the estimation), and single step best linear unbiased prediction (ssBLUP, in which all information of individuals with or without genomic information are included in one model for the analysis) [2,8]. It has been reported that the estimation was more accurate when genomic information is used than when only pedigree information is used for animals without genomic information. In addition, ssBLUP was more accurate than BLUP for genetic estimation [2,8].
This experiment was conducted to compare the selection accuracy between genomic breeding value estimation using genomic information and breeding value estimation of BLUP using conventional pedigree information after collecting phenotypic and genomic information for the total number of piglets born in Landrace pigs. In addition, the relationship between estimated breeding value and phenotype information after farrowing was investigated when juvenile selection was made in candidate pigs without phenotype information.
MATERIALS AND METHODS
Single nucleotide polymorphism data and quality control
Using Illumina Porcine SNP60 v1 and v2 beadchip genotype analysis was performed for a total of 1,041 sows and boars with the records of total number of piglets born (TNB) and candidate pigs without records. Genotype information on 62,551 SNP markers were collected, and using 48,245 SNP markers quality control was performed after 12,627 SNPs whose position information was not identified and 1,679 SNPs on sex chromosome were excluded.
For quality control, markers with more than 10% of missing rate, markers without polymorphism (all homo or hetero genotype markers), markers with less than 1% of minor allele frequence, and markers with more than 23.93 (p<10−6) of Hardy Weinberg disequilibrium chi square value, and genomic information of animals with more than 20% of SNP missing rate were excluded. A total of 1,038 animals passed quality control and a total of 36,392 SNP markers were used in this experiment (Table 1).
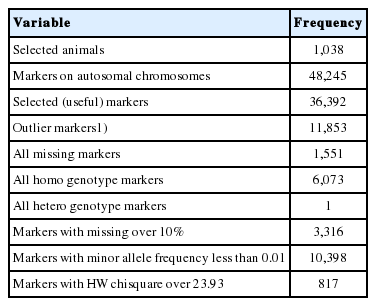
Frequency of variables after the quality control of raw single nucleotide polymorphisms dataset
Phenotypic data for validation of selection accuracy
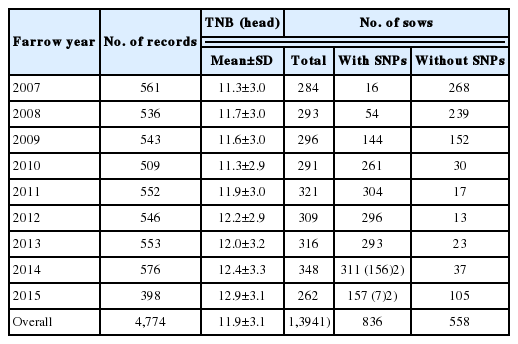
Of the 1,038 pigs with SNP information obtained from Sunjin GGP farm, a total of 916 pigs (836 sows and 80 boars) were used for the selection accuracy test. Data from 122 candidate pigs were not analyzed. Of the 836 sows with SNP information, 673 sows had records of total number of piglets born. The remaining 163 pigs were gilts without records of total number of piglets born (Table 2). Using the records from 916 pigs, the estimated breeding values for total number of piglets born were compared. To determine the relationship of total number of piglets born with phenotype by selection ratio, records for the total number of piglets born from the 163 gilts were collected from 2014 to 2015. Total number of animals in the A matrix and generations were 2,864 heads and 12, respectively.
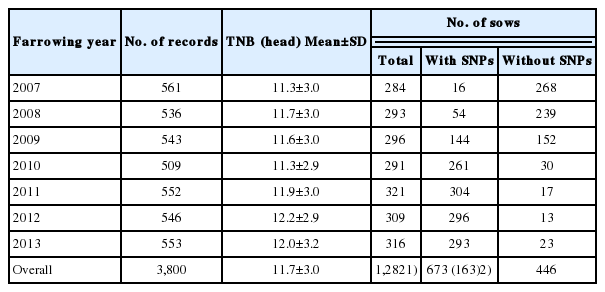
Distributional properties of data for the total number of piglets born (TNB)
Statistical models
Linear model for the estimation of genetic parameters and breeding values was as follows:
Where, yijkl = observed value of total number of piglets born, overall average, Pi = ith fixed effect of parity, YSj = jth fixed effect of farrowing year-season, ak = kth additive genetic effect (breeding value), pek = kth permanent environmental effect of animals, eijkl = residual effects.
Genetic parameters
Variance components for total number of piglets born were estimated using VCE ver. 6.0 (Institute of Farm Animal Genetics, Friedrich Loeffler Institute, Neustadt, Germany) and heretability (h2) and repeatability (r) calculation formulars were as follows:
where,
Estimation of genomic breeding values
For the fixed effect, parity and farrowing year-month were included and the analysis model was as follows:
Where, y = n×1 vector of observation, b = p×1 vector of fixed effect, a = q×1 vector of additive genetic random effect, p = q×1 vector of permanent environmental random effect, X(n×p), Z(n×q), and W(n×q) known incidence matrix corresponding to b, a, and p, e = n×1 vector of residual effect.
Mixed model equation (MME) was as follows:
Where,
RESULTS AND DISCUSSION
Genetic parameters
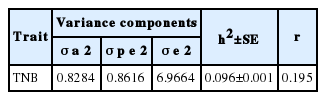
In this experiment, the estimated heritability of total number of piglets born was 0.096, which was higher than that (0.08) of Su et al [9] and Chen et al [10]. It has been reported that the heritability estimates of total number of piglets born in Yorkshire, Duroc, and Berkshire pigs were 0.10, 0.09, and 0.07, respectively [10,11]. The heritability for total number of piglets born could vary due to different genetic characteristics of the population. Generally, it is around 0.1 or lower [12]. The estimated repeatability for total number of piglets born was 0.195. Variance components and genetic parameters are shown in Table 3.
Additive genetic (
Accuracy of estimated breeding value and genomic estimated breeding value
Since the accuracies of estimated breeding value can vary with different numbers of test records, pedigree information, and heritability, after classifying sows with or without records for the total number of piglets born, the accuracies of breeding values obtained from BLUP and ssGBLUP were estimated. Results are shown in Table 4. When ssBLUP method was used, the accuracy was higher than that when conventional BLUP method was used. The difference in accuracy was bigger in pigs without phenotypic records. This results coincided with those of Forni et al [13]. As a result, there was relatively high accuracy difference in young animals without phenotypic data. When genomic information was used, the accuracy was increased. Such improved accuracy might be due to the fact that numerator relationship matrix used for BLUP was substituted by the genomic relationship matrix derived from the similarity of genotype of all markers with Mendelian sampling.
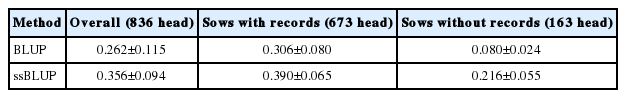
Means and standard deviations of estimated breeding value (EBV) and genomic estimated breeding value (GEBV) accuracies in animals with or without records for the total number of piglets born (TNB) by the estimation methods
Correlationw analysis was performed between genomic estimated breeding value (GEBV) estimated from ssBLUP and breeding value estimated from conventional BLUP using only pedigree information (Figure 1). The estimated correlation coefficient of between GEBV and estimated breeding value (EBV) was 0.83. The estimated regression equation was y = 0.12+0.94X (r2 = 0.68).
Correlation between estimated breeding value (EBV) and genomic estimated breeding value (GEBV) for the total number of piglets born (TNB).
When there was no phenotypic data in the progeny of pigs with the estimated genomic breeding value, breeding value estimated using BLUP method was the average breeding value of parents. Therefore, pigs with same parents had the same breeding values. On the other hand, since genomic breeding value was estimated using individual genomic information, accurate breeding value with Mendelian sampling could be calculated. Therefore, genomic breeding value seems to be more efficient than breeding value estimated using BLUP for selecting candidate pigs.
Relationship between selection ratio and phenotype
From late 2013, genomic information was collected from 63 candidate pigs. They began to farrow from the year of 2014. Records for total number of piglets born were collected. Of 348 sows farrowed in 2014, genomic information was obtained from 311 sows. The remaining 37 sows had no genomic information. Of the 311 sows with genomic information, 156 were candidate sows with first parity. By 2015, the overall average for total number of piglets born in GGP farms was 11.9. The distributional properties of validation data by year are shown in Table 5.
Distributional properties of validation data of the phenotypic total number of piglets born (TNB) by best linear unbiased prediction (BLUP) and single step best linear unbiased prediction (ssBLUP) methods
To determine the relationship between selection ratio and phenotype, 163 candidate pigs were divided into 5 groups by selection ratio (from top 10% to middle 50% candidate pigs). The mean values of total number of piglets born were compared (Table 6).
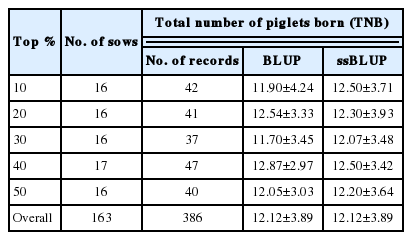
Means and standard deviations for the total number of piglets born (TNB) by selection ratio and the estimation method
When candidate pigs for the next generation were selected by breeding values estimated from the conventional BLUP method, the total numbers of piglets born were severely fluctuated in pigs from Top 10% to 50%. In pigs of top 20% to 30%, the total number of piglets born was lower than the population average, suggesting that the accuracy of the estimated breeding value was very low. On the other hand, when they were selected by GEBV of ssBLUP using genomic information, it was always higher than the population average (Figure 2). These results proved that the accuracy was higher when genomic information was used for selection than that when pedigree information was used for selection.
Trends on the total number of piglets born (TNB) by selection ratio and the estimation method.
Genetic gain
To calculate the genetic gain using the formula of (ΔG) = rGP×i ×σa/L, selection of sows from the tested sows for the total number of piglets born was based on pedigree information. Of 5,000 tested sows, 550 were selected (recently replacement rate of sows is 100%). Of 500 tested boars, 45 were selected. Therefore, the selection intensity (i) was 1.76. Genetic standard deviation (σa) for the total number of piglets born was 0.91. Since there was no data on the total number of piglets born for candidate pigs, the accuracy of the breeding value estimated from pedigree information was 0.080. When genomic information was used, the accuracy was 0.216 (Table 7). Assuming the replacement rate of sows per year at 100% and generation interval of 1 year, genetic gain per year would be 0.346 heads when genomic information was used and 0.128 when BLUP was used. Therefore, genetic gain estimated using ssBLUP method was 2.7 times higher than that estimated using BLUP method, i.e., 270% more efficient in improvement efficiency.
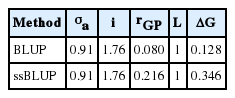
Genetic gains of the total number of piglets born (TNB) per year by the selection method of candidate sows
CONCLUSION
The selection accuracy was higher when sows were selected through the GEBV method using many markers than that when sows were selected through the conventional BLUP method using pedigree information. The selection accuracy was especially high for pigs with only genomic information (no phenotypic data). Accurate juvenile selection of them is possible using the GEBV method.
ACKNOWLEDGMENTS
This work was supported by a grant (PJ01111502) of the Next Generation BioGreen 21 Program funded by Rural Development Administration, Republic of Korea.
Notes
CONFLICT OF INTEREST
We certify that there is no conflict of interest with any financial organization regarding the material discussed in the manuscript.