Effects of different ratios and storage periods of liquid brewer’s yeast mixed with cassava pulp on chemical composition, fermentation quality and in vitro ruminal fermentation
Article information
Abstract
Objective
This study aims to evaluate the chemical composition, fermentation quality and in vitro ruminal fermentation of various ratios and storage periods of liquid brewer’s yeast (LBY) mixed with cassava pulp (CVP).
Methods
Four mixtures of fresh LBY and CVP were made (LBY0, LBY10, LBY20, and LBY30 for LBY:CVP at 0:100, 10:90, 20:80, and 30:70, respectively) on a fresh matter basis, in 500 g in plastic bags and stored at 30 to 32°C. After storage, the bags were opened weekly from weeks 0 to 4. Fermentation quality and in vitro gas production (IVGP) were determined, as well as the dry matter (DM), organic matter (OM), crude protein (CP), ether extract (EE), neutral detergent fiber, acid detergent fiber and acid detergent lignin contents.
Results
The contents of CP and EE increased, whereas all other components decreased, in proportion to LBY inclusion (p<0.01). The DM and OM contents gradually decreased in weeks 3 and 4 (p<0.05), while EE contents were lowest in week 0. The pH, ammonia nitrogen per total nitrogen (NH3-N/TN) and V-score in each mixture and storage period demonstrated superior fermentation quality (pH≤4.2, NH3-N/TN≤12.5%, and V-score>90%). The pH increased and NH3-N/TN decreased, with proportionate increases of LBY, whereas the pH decreased and NH3-N/TN increased, as the storage periods were extended (p<0.01). Although IVGP decreased in proportion to the amount of LBY inclusion (p<0.01), in vitro organic matter digestibility (IVOMD) was unaffected by the mixture ratios. The highest IVGP and IVOMD were observed in week 0 (p<0.01).
Conclusion
The inclusion of LBY (as high as 30%) into CVP improves the chemical composition of the mixture, thereby increasing the CP content, while decreasing IVGP, without decreasing fermentation quality and IVOMD. In addition, a preservation period of up to four weeks can guarantee superior fermentation quality in all types of mixtures. Therefore, we recommend limiting the use of CVP as a feed ingredient, given its low nutritional value and improving feed quality with the inclusion of LBY.
INTRODUCTION
The lack of a high quality diet to feed livestock has become a very urgent problem for small farmers in developing countries. A solution using a relatively high amount of commercial concentrate would be possible, if the farmers had access to such a concentrate. However, feedstuff concentrates are expensive, as most contain protein sources, such as soybean meal. Cheap by-products (and waste products) obtained from local industries have often been utilized by small farmers, living around the factories. Specific by-products obtained from the production of beer, such as brewers’ grains and brewers dried yeast, have been used in animal feed [1,2]. Saccharomyces cerevisiae is the prevalent budding yeast microbe involved in brewing [3] and is considered to be a generally accepted alternative by-product for livestock feed, due to its high nutritional value [4]. Liquid brewer’s yeast (LBY), obtained by removal of yeast after fermentation in the beer brewing process, contains at least 32% crude protein (CP) on a dry matter (DM) basis [5]. Compare to basic diets, supplementing LBY improved dry matter intake and resulted in more rapid gains, and there was no difference between yeast- and soybean- supplemented rations [6]. Furthermore, supplementary LBY (6% to 12% DM) in complete rations for lactating cows did not affect milk yield, composition or quality [7].
Consequently, small farmers in Thailand have approached the factories of beer manufactures to obtain LBY for dairy cattle feeding. One such factory in Northeast Thailand has a beer production capacity of 700 million liters per year [8]. It is thought that they generate about 1,000 m3 LBY per month and about 40% of this amount is received by farmers within the vicinity (unconfirmed estimate). Cassava (Manihot esculenta Crantz.) pulp (CVP) is produced as a by-product of starch manufacturing, and is a major biomass resource in animal feedstock. In 2013, approximately 15 million tons of fresh cassava roots were extracted from the fields in Northeast Thailand [9]. Approximately 10% to 15% of the resulting cassava pulp was utilized as livestock feed [10], and contained 17% to 19% DM [11], as well as high rates of starch and cellulose (approximately 60% and 20% on a DM basis, respectively [12]). However the CP content, 2.4% DM, was relatively low [13].
Several studies have been conducted to enrich the CP content of cassava pulp through various treatments in solid-state fermentation, such as yeast culturing [14] and microorganic fermentation [15,16,17]. The use of LBY, a liquid state fermentation product mixed with CVP, offers farmers enriched protein at lower overall feed costs. Since both LBY and CVP have high moisture contents, the livestock feed must be stored in bunkers after mixing, in preparation for transportation to distant farmers. Therefore, maintaining an optimum ratio of LBY and CVP during the necessary storage periods is critical for its practical use in farms. This study aims to evaluate the chemical composition, fermentation quality and in vitro ruminal fermentation of various ratios and storage periods of LBY mixed with CVP.
MATERIALS AND METHODS
Sample preparation
Experiments were conducted at Khon Kaen Animal Nutrition Research and Development Center, in May 2013. Fresh LBY and CVP, obtained from a brewery and a starch factory, respectively in the Khon Kaen Province, were collected in four mixtures (LBY0, LBY10, LBY20, and LBY30), in LBY:CVP ratios of 0:100, 10:90, 20:80, and 30:70, respectively, on a fresh matter basis. Twenty composites of 500 g were made from each mixture and packed into 15×23 cm plastic bags. The bags were sealed using a vacuum sealer and stored at room temperature (30°C to 32°C). Four bags from each mixture were opened for analysis at 0, 1, 2, 3, and 4 weeks after storage.
Chemical analyses
A 50 g sample from each composite was homogenized with 100 mL of distilled water and stored overnight in a refrigerator, at 4°C. The homogenate was then filtered through Whatman no.5 filter paper for pH, ammonia nitrogen (NH3-N), lactic acid (LA) and volatile fatty acid (VFA) determination. The pH was measured by pH meter (D-22; Horiba, Kyoto, Japan) and the NH3-N content was determined using a steam distillation technique [18]. The remaining sample mixture was oven dried at 60°C for 48 h. The dried samples were ground to pass through a 1 mm screen for subsequent analyses of DM (on oven drying procedure at 135°C for 2 h), CP, ether extract (EE) and crude ash (CA), according to the Association of Official Analytical Chemists [19]. The organic matter (OM) was calculated as lost weight through ashing. Neutral detergent fiber (NDFom) and acid detergent fiber (ADFom), expressed exclusive of residual ash without amylase treatment and acid detergent lignin (ADL) were determined according to the methods of [20]. LA and VFA concentrations were determined by using high performance liquid chromatography (LC-20A; Shimadzu, Kyoto, Japan), using a Nova-pak C18 steel column: 3.9×300 mm, according to the methods of [21]. The flow rate was 0.5 mL/min and the wavelength of UV detector was 210 nm. To assess the quality of the mixture, the V-scores were calculated from the NH3-N/TN and VFA concentrations [18]. According to the scoring criteria, the samples were divided into three ranks: superior (81 to 100), good (60 to 80) and bad (<60) [22].
In vitro gas production analyses
Buffered mineral solution [23] was prepared and placed in a water bath at 39°C under continuous CO2 flushing. Rumen fluid was collected from two fistulated Brahman crossbred cattle, prior to their morning feeding. The dried and ground samples, were weighted (200 mg each) and inserted into two 100 mL calibrated glass syringes. The samples were incubated in vitro with the buffered rumen fluid (30 mL each) in calibrated glass syringes, duplicated for each sample. The ratio of rumen fluid to buffered mineral solution was 1:2. Gas production volume was recorded at 6, 12, 24, and 48 h of incubation and gas production of the incubated mixtures was calculated for mean blank value over a 24 h period [23], through the following equations.
Where GP = gas production (mL/mg DM), V0 = volume at 0 h (mL), V24 = volume at 24 h (mL), and GP0 = the mean blank value at 0 h (mL).
Organic matter digestibility (OMD) and metabolizable energy (ME) were estimated [23], in the 24 h gas production period, through the following equations.
Where GP = gas production at 24 h (mL/200 mg DM), XP = CP content (g/kg DM), XE = EE content (g/kg DM), and XA = crude ash content (g/kg DM).
Statistical analysis
Data were analyzed with repeated measures, using the PROC MIXED procedure of SAS [24], through the following model: Yijk = μ+Mi+Sj+(MS)ij+eijk, where Yijk is the observed value, μ is overall mean, Mi is the effect associated with the mixture ratio, Sj is the effect associated with the storage periods, (MS)ij is the interaction effect between mixture ratio and storage period and eijk is residual (s).
The orthogonal polynomial contrast examined linear and quadratic responses to the LBY mixture ratios and storage periods and Duncan’s new multiple range test detected the differences between the means of each data analysis [25]. Correlation coefficients among parameters from chemical composition, gas production, OMD and ME were calculated through Pearson’s correlation. Significances were declared at p<0.05.
RESULTS
Chemical composition of the mixtures of liquid brewer’s yeast and cassava pulp
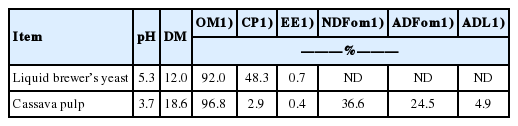
The chemical compositions of fresh LBY and CVP prior to mixing are shown in Table 1. The pH, and DM, OM, CP, and EE contents of the LBY were 5.3, and 12.0%, 92.0%, 48.3%, and 0.7% on a DM basis, respectively. The NDFom, ADFom and ADL contents were undetected in the LBY. The CVP displayed pH, and DM, OM, CP, EE, NDFom, ADFom, and ADL contents at 3.7, and 18.6%, 96.8%, 2.9%, 0.4%, 36.6%, 24.5%, and 4.9%, respectively.
pH and chemical composition of experimental diets
Changes within the chemical composition of the four mixture ratios and five storage periods are shown in Table 2. Among the mixture ratio means, the DM, OM, CP, EE, NDFom, ADFom, and ADL of the four mixtures ranged 16.5% to 18.0%, 95.7% to 96.6%, 3.2% to 14.1%, 0.4% to 0.5%, 32.0% to 36.2%, 21.1% to 24.8%, and 3.8% to 4.9%, respectively. The results were dependent on the differences in chemical composition and mixture ratio within the LBY and CVP. Increasing the level of LBY linearly increased CP and EE contents, and decreased other chemical compositions (p<0.01). For the means of storage period, the DM and OM contents linearly and quadratically decreased, while the EE and ADFom contents increased linearly, as the storage periods progressed (p≤0.01). The interaction effects between mixture ratios and storage periods on DM, OM, CP, EE, and ADFom are identified in Table 2.
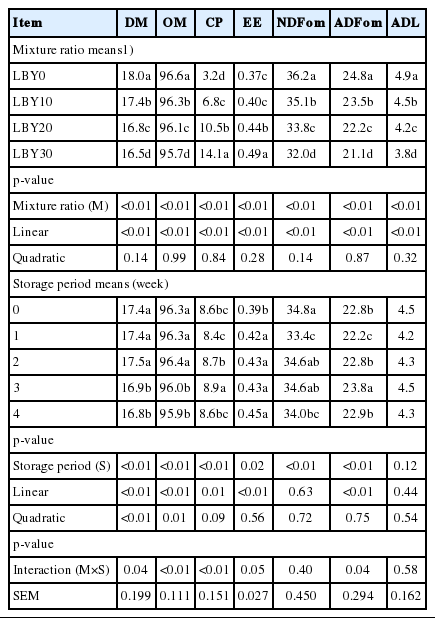
Chemical composition of mixture of liquid brewer’s yeast (LBY) and cassava pulp (CVP) at different ratios and storage periods (%)
Fermentation quality in the liquid brewer’s yeast and cassava pulp mixtures
Table 3 shows the changes in pH, NH3-N/TN, LA, and VFA concentrations of the mixture during the storage period (p≤0.01). All parameters were quadratically affected by the mixture ratios, and acute increases in pH, acetic and butyric contents, as well as decreases in NH3-N/TN, LA contents and V-scores were observed in the progression from LBY0 to LBY10. More specifically, the quadratically increases of acetic and propionic acids and the linear decrease in V-scores were more severe in the later preservation periods. The interaction effects between the mixture ratios and storage periods were observed in pH, LA, acetic, propionic and butyric acid contents, and V-score (p<0.01), (Figure 1).
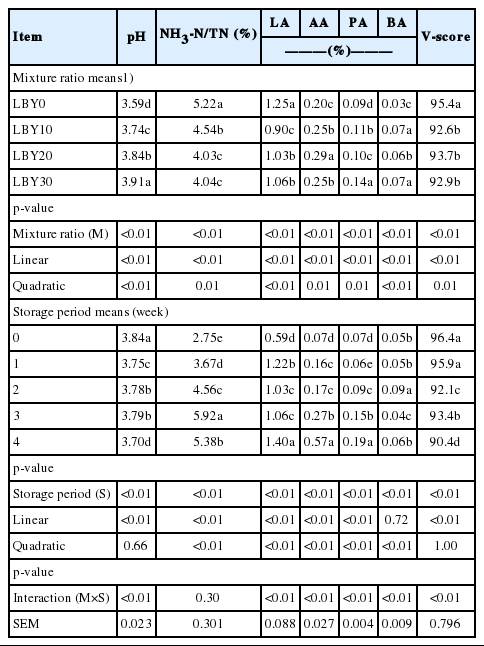
Fermentation quality of mixture of liquid brewer’s yeast (LBY) and cassava pulp (CVP) at different ratios and storage periods

pH, lactic acid, acetic acid, propionic acid, butyric acid and V-score showing interaction effects between mixture ratio and storage period. Bars are standard error of the means. Symbols: ♦, LBY0; ■, LBY10; ▲, LBY20; ×, LBY30. LBY0, 10, 20, and 30, mixture ratios of LBY:CVP at 0:100, 10:90, 20:80, and 30:70, respectively, on a fresh matter basis. LBY, liquid brewer’s yeast; CVP, cassava pulp. Different letters indicate a significant difference between treatments in each storage period (p<0.05).
Gas production, estimated OMD, ME, and their relationship with chemical composition
Gas production from the mixture of LBY and CVP with different mixture ratios, storage periods and post incubation parameters, described as OMD and ME, are shown in Table 4. Comparing the mixture ratio means, the gas production of LBY0 and LBY10 differed only slightly (p<0.01), yet were higher than that of LBY20 and LBY30, at 6 and 12 h of incubation time. LBY0 reported the highest value at 24 and 48 h. The gas production at 48 h decreased quadratically with the inclusion of LBY. As indicated within the storage period means, gas production decreased as the storage period increased, especially within weeks 0 to 1. The interaction effects between the mixture ratios and storage periods were observed in the 6, 24, and 48 h (Table 4). Among the four mixture ratio means, estimated OMD and ME ranged from 77.4% to 79.7% and 11.4 to 11.8 MJ/kg DM, respectively, each scoring lowest in LBY20 (p<0.05). Figure 2 provides the interaction effects of the mixture ratios and storage periods for both OMD and ME (p<0.01).

Gas production, organic matter digestibility and metabolizable energy of mixture of liquid brewer’s yeast (LBY) and cassava pulp (CVP) at different ratios and storage periods

Gas production at 48 h, organic matter digestibility (OMD) and metabolizable energy (ME) showing interaction effects between mixture ratio and storage period. Bars are standard error of the means. Symbols: ♦, LBY0; ■, LBY10; ▲, LBY20; ×, LBY30. LBY0, 10, 20, and 30, mixture ratios of LBY:CVP at 0:100, 10:90, 20:80, and 30:70, respectively, on a fresh matter basis. LBY, liquid brewer’s yeast; CVP, cassava pulp. Different letters indicate a significant difference between treatments in each storage period (p<0.05).
The correlation coefficients between chemical compositions, OMD, ME, and in vitro gas production (IVGP) are shown in Table 5. DM and OM contents were positively correlated at 6 h (p<0.05), 12 and 24 h (p<0.01) and 48 h (p<0.05). NDFom and non-fiber carbohydrate (NFC) contents were positively correlated at 12, 24, and 48 h (p<0.01). The NH3-N/TN contents at 6 h incubation were also positively correlated (p<0.01). Contrastingly, the CP content was negatively correlated at 12 h (p< 0.05), and at 24 and 48 h (p<0.01). EE content was also negatively correlated at 6 h (p<0.05), 12 and 24 h (p<0.01) and 48 h (p<0.05). OMD and ME did not significantly correlate with the chemical composition.

Correlation coefficients (r) between chemical compositions, in vitro gas production, organic matter digestibility and metabolizable energy
DISCUSSION
Chemical composition and fermentation characteristics
Comparatively, the LBY in this experiment had lower DM and CP contents than the compositions within the study conducted by [26], (14.4% and 53.0%), yet fell within the same range of those within the study conducted by [6], (10.8% to 13.4% and 43.1% to 51.4%). The CVP was highly acidic, and the pH (3.66) was lower than that reported by [11], (3.89). These variations may be a result of different materials, plant locations and processing. However, the CP, EE, NDFom, and ADFom contents of CVP in this study were similar to the sample means of a report of three starch factories in Northeast Thailand, by [13], at 2.4%, 0.4%, 40.1%, and 25.3% on a DM basis, respectively.
In this study, CP content increased (p<0.01) with the amount of LBY inclusion in the mixture from 3% to 14%, with the 0% to 30% proportion of LBY (Table 2), which attributed to a higher CP content in LBY than in CVP. The linear declines of DM, NDFom, ADFom, and ADL contents from LBY10 to LBY30 were caused by the decreases in the proportions of CVP, which contained a higher ratio of DM and fiber contents, than LBY.
Through prolonged storage periods, the contents of DM and OM in the mixture declined in contrast with the increase in CP content, which agreed with the findings of [27]. The decline of DM and OM may have been due to the generation of moisture and loss of fermentation substrates, such as NFC.
The changes in fermentation characteristics indicate that LBY0 had the lowest pH, given the strong acidic content of CVP, due to the starch extraction process [10]. While NH3-N/TN ranked the least amount of content within the mixture, it was highest in LBY0, which may have been due to the relatively lower CP content in LBY0. [28] reported a CVP which an NFC as high as 25% on a DM basis. In the present study, the CVP’s NFC content was estimated as 56.8% on a DM basis, through the equation NFC = 100−(CP+EE+NDFom+CA). The higher LA content may have been a result of the higher NFC content in CVP as a substrate for the fermentation of LA.
During preservation, the pH of each treatment decreased from weeks 0 to 4. These results coincide with the study of [11], which found that the pH of CVP continuously decreased from 3.89 to 3.40 during 28 days of ensiling. The NH3-N/TN, as well as the acetic and propionic acid contents, gradually increased during the preservation of all LBY levels. However, the NH3-N/TN content increased only slightly, at 2.8% to 5.9%. According to [29], an NH3-N content of less than 10% of total nitrogen has been identified as a characteristic of well-preserved silage. Previous research on ensiling wet by-products have also indicated low propionic acid contents and very small (if any) quantities of butyric acid [30,31]. The V-score means in all mixture ratios and storage periods were higher than 90%, which suggested that the mixture had superior fermentation quality in all preservation periods [22].
Gas production, estimated OMD, ME and their relationship with chemical composition
The gas production technique is widely used for evaluating nutritive values in ruminant feeds. In this study, each mixture had high GP early in the fermentation period, which may have been due to its low fiber content (Table 4). The highest GP of LBY0 (reduced with the inclusion of LBY) may also be explained by the low fiber content. However, GP reduced with increased CP content, as well as with decreased DM and NDFom contents (Table 4). These same results were initiallty found in the study of [32], which suggested that GP reduced with increased CP levels. The estimated ME values of the four mixture ratios, ranging from 11.4 to 11.7 MJ/kg DM (p<0.05), were higher than those reported in the studies of [33], (10.89 MJ/kg DM) and [34], (10.04 MJ/kg DM).
The gas production parameters suggest differences in nutritive values that are closely related to their chemical composition [35]. In this study, we found strong negative correlations between GP and the contents of CP and EE (Table 5), consistent with the study of [36]. While, the contents of DM, OM, NDFom, and NFC were positively correlated with GP, it is likely that NDFom and NFC in the mixture were highly fermentable, demonstrated by low-NDF fall-grown oat forages [37]. The NH3-N/TN content was positively correlated with GP in the first 6 h of incubation, which might have reflected the synchronizing fermentable nitrogen with carbohydrates, present in early fermentation. The OMD and ME, however, did not significantly correlated with any chemical composition.
We found that the inclusion of LBY (up to 30%) into CVP can significantly improve the chemical composition of a feed mixture. A remarkable increase in CP content with decreased IVGP was achieved, with acceptable fermentation quality and without decreasing in vitro organic matter digestibility. In addition, we determined that a preservation period of up to four weeks could assure superior fermentation quality in all types of mixtures. Therefore, a low nutritive value of livestock feed, due to the limitation of CVP as a feed ingredient, can be instantly improved by the inclusion of LBY.
ACKNOWLEDGMENTS
This study was financially supported by Agricultural Research Development Agency (Public Organization), Thailand.
Notes
CONFLICT OF INTEREST
We certify that there is no conflict of interest with any financial organization regarding the material discussed in the manuscript.