Effects of Condensed Tannins in Mao (Antidesma thwaitesianum Muell. Arg.) Seed Meal on Rumen Fermentation Characteristics and Nitrogen Utilization in Goats
Article information
Abstract
Mao seed is a by-product of the wine and juice industry, which could be used in animal nutrition. The current study was designed to determine the effect of supplementation of mao (Antidesma thwaitesianum Muell. Arg.) seed meal (MOSM) containing condensed tannins (CT) on rumen fermentation, nitrogen (N) utilization and microbial protein synthesis in goats. Four crossbred (Thai Native×Anglo Nubian) goats with initial body weight (BW) 20±2 kg were randomly assigned to a 4×4 Latin square design. The four dietary treatments were MOSM supplementation at 0%, 0.8%, 1.6%, and 2.4% of total dry matter (DM) intake, respectively. During the experimental periods, all goats were fed a diet containing roughage to concentrate ratio of 60:40 at 3.0% BW/d and pangola grass hay was used as a roughage source. Results showed that supplementation with MOSM did not affect feed intake, nutrient intakes and apparent nutrient digestibility (p>0.05). In addition, ruminal pH and ammonia nitrogen (NH3-N) were not influenced by MOSM supplementation, whilst blood urea nitrogen was decreased quadraticly (p<0.05) in goats supplemented with MOSM at 2.4% of total DM intake. Propionate was increased linearly with MOSM supplementation, whereas acetate and butyrate were remained the same. Moreover, estimated ruminal methane (CH4) was decreased linearly (p<0.05) when goats were fed with MOSM at 1.6% and 2.4% of total DM intake. Numbers of bacteria and protozoa were similar among treatments (p>0.05). There were linear decreases in urinary N (p<0.01) and total N excretion (p<0.01) by MOSM supplementation. Furthermore, N retention was increased linearly (p<0.05) when goats were fed with MOSM supplementation at 1.6% and 2.4% of total DM intake. Microbial protein synthesis were not significantly different among treatments (p>0.05). From the current study, it can be concluded that supplementation of MOSM at 1.6% to 2.4% of total DM intake can be used to modify ruminal fermentation, especially propionate and N utilization in goats, without affecting the nutrient digestibility, microbial populations and microbial protein synthesis.
INTRODUCTION
Many feed additives have been developed to improve the efficiency of nutrient use by decreasing methane (CH4) production and reducing nitrogen (N) excretion, among which ionophore antibiotics have been successful. However, ionophore antibiotics have been banned in Europe since 2006, and many countries outside the European Union are also considering a ban (Jayanegara et al., 2009). For this reason, attention has recently shifted to natural antimicrobials as a safe means of modifying ruminal fermentation. Currently, the use of plant secondary compounds, including tannins and saponins, that are potent modifiers of ruminal fermentation and intraruminal recycling of microbial protein aims at improving the efficiency of dietary N utilization and mitigating N losses in ruminants (Hristov and Jouany, 2005).
Mao or Mamao (Antidesma thwaitesianum Muell. Arg.) is favored by consumers in the local market in Thailand because of its good color and taste. Mao grows very well over a variety of soil types and is naturalised in Africa, Australia, islands in the Pacific Ocean and tropical Asia. Currently, Mao juice and mao wine industry produce very large amounts of seed and skin pulp, which is considered as an environmental problem. Mao seed contains a large amount of plant secondary compounds, especially condensed tannins (CT) (Gunun et al., 2014). Our previous study (Gunun et al., 2014) illustrated that supplementation with mao seed has the potential to manipulate rumen fermentation, by decreasing protozoa. However, mao seed meal (MOSM) have not been investigated for use as feed additives in in vivo. Therefore, the objective of this study was to investigate the effect of MOSM supplementation on rumen fermentation, microbial populations, N utilization and microbial protein synthesis in goats.
MATERIALS AND METHODS
Animals, treatments and experimental design
Four crossbred (Thai Native×Anglo Nubian) goats with initial body weight (BW) 20±2 kg were randomly assigned to a 4×4 Latin square design. The dietary treatments were as follows: Supplementation with MOSM at 0%, 0.8%, 1.6%, and 2.4% of total dry matter (DM) intake. Fresh mao seed was provided from Department of Food Science and Technology, Faculty of Natural Resources, Rajamangala University of Technology-Isan, Sakon Nakhon Campus, Thailand; and sundried for 2 to 3 days, then ground to pass a 1 mm sieve. All animals were fed a diet containing roughage to concentrate ratio (R:C) of 60:40 at 3.0% BW/d and pangola grass (Digitaria eriantha Steud., synonym D. decumbens) hay was used as a roughage source. The diet of R:C was offered to the animals twice per day in the morning (07:00) and afternoon (16:00). Goats were housed individually in ventilated pens with wooden slotted flooring in an open goat barn raised above the ground. Clean fresh water and feed blocks were available at all times. The experiment was conducted over four periods, each lasting for 21 days: The first 14 days were used for feed intake measurements and the remaining 7 days for total urine and fecal collection. Chemical compositions of concentrate and pangola grass hay are presented in Table 1.

Ingredients and chemical composition of concentrate, pangola grass hay and mao seed meal (MOSM) used in the experiment
Data collection and sampling procedures
Feeds offered and refusals samples were collected during the last 7 days of each period in the morning and afternoon feedings. Fecal samples were collected from the total collection of each individual goat on each treatment during the last 7 days of each period in the morning and afternoon feeding. Feed, refusals and fecal samples were dried at 60°C, ground (1 mm screen using a Cyclotech Mill, Tecator, Hoganas, Sweden) and analysed using the standard methods of AOAC (1995) for DM, crude protein (CP), and ash, while neutral detergent fiber (NDF) and acid detergent fiber (ADF) were analysed according to Van Soest et al. (1991). Content of CT in MOSM was analysed using the modified vanillin-HCl method based on Burns (1971). Crude saponin concentrations were measured using methanol extraction following the method of Kwon et al. (2003) and modified by Poungchompu et al. (2009).
Urine samples were analyzed for total N according to AOAC (1995), and allantoin in urine was determined by high-performance liquid chromatography (HPLC) (Instruments by controller water model 600E, Milford, MA, USA; water model 484 UV detector; column novapak C18; column size 3.9 mm×300 mm; mobile phase 10 mM H2PO4 [pH 2.5]) as described by Chen et al. (1993). The amount of microbial purines absorbed (X, mmol/d) presumably proportional to the purine derivatives (PD) excreted (Y, mmol/d), was estimated based with the following equation described by Chen et al. (1990) for sheep as: Y = 0.84X+(0.150BW0.75e−0.25X). The supply of microbial N (MN) was estimated by urinary excretion of PD according to Chen and Gomes (1995): MN (g/d) = 70X/(0.116×0.83×1,000) = 0.727X; where X is PD absorption in mmol/d, digestibility of microbial purine is 0.83, the N content of purines is 70 mg N/mmol, and the ratio of purine-N:total N in mixed rumen microbes is 11.6:100. The efficiency of microbial N synthesis (EMNS) to denote the microbial N supplied to the animal per unit of digestible organic matter apparently fermented in the rumen (DOMR) was calculated using the following formula: EMNS = MN (g/d)/DOMR (assuming that rumen digestion was 65% organic matter of digestion in total tract, DOMR = DOMI×0.65; DOMI = digestible organic matter intake).
At the end of each period, rumen fluid was collected at 0, 3, and 6 h post-feeding. Rumen fluid was taken from the rumen by a stomach tube connected to a vacuum pump. Ruminal pH was determined using a portable pH meter (HANNA Instruments HI 8424 microcomputer, Singapore). Rumen fluid samples were then filtered through 4 layers of cheesecloth and divided into two portions. The first portion was used for ammonia nitrogen (NH3-N) analysis, comprised 5 mL of 1 M H2SO4 and 50 mL of rumen fluid. It was centrifuged at 16,000 g for 15 min and the supernatant stored at −20°C. Ruminal NH3-N concentrations were analysed using a Kjeltech Auto 1030 Analyzer, Tecator, Hoganiis, Sweden (AOAC, 1995) and volatile fatty acids (VFA) analysis was performed using HPLC (Instruments by controller water model 600E; water model 484 UV detector; column novapak C18; column size 3.9 mm×300 mm; mobile phase 10 mM H2PO4 [pH 2.5]) (Samuel et al., 1997). CH4 production was calculated by standard equations according to CH4 = 0.45 (acetate)−0.275 (propionate)+0.40 (butyrate) (Moss et al., 2000). A second portion was fixed with 10% formalin solution in sterilized 0.9% saline solution. The total direct counts of bacteria and protozoa were made by the methods of Galyean (1989) based on the use of a haemocytometer (Boeco, Hamburg, Germany).
A blood sample (about 10 mL) was collected from the jugular vein at the same time as rumen fluid sampling into tubes containing 12 mg of ethylene diaminetetraacetic acid, and plasma was separated by centrifugation at 500 g for 10 min at 4°C and stored at −20°C until analysis of blood urea nitrogen (BUN) according to Crocker (1967).
Statistical analysis
All data were subjected to analysis of variance according to a 4×4 Latin square design using the general linear models procedures (SAS, 1996). Data were analyzed using the model: Yijk = μ+Di+Pj+gk+eijk; where Yijk = the dependent variable, μ = overall mean, Di = fixed effect of diet, Pj = fixed effect of period, gk = random effect of goat, and eijk = residual error. Orthogonal polynomial contrasts (linear, quadratic and cubic) were used to estimate the effect of MOSM supplementation. Significant effects were identified at p<0.05.
RESULTS
Chemical composition of diet
Table 1 shows feed ingredients and chemical compositions of concentrate, pangola grass hay and MOSM. The concentrate diet was formulated by using available local feed resources and contained CP and NDF at 16.1% and 28.1%, respectively. Moreover, pangola grass hay contained CP and NDF at 7.9% and 67.6%, respectively. MOSM contained CP, NDF, and CT at 10.7%, 65.0%, and 9.6%, respectively.
Feed intake and nutrient digestibility
Results of feed intakes and apparent nutrient digestibilities as influenced by MOSM supplementation are presented in Table 2. The results show that feed intake, nutrient intakes and apparent nutrient digestibility were not affected by MOSM supplementation (p>0.05).

Effect of mao seed meal supplementation on feed intake and nutrients digestibility in goats
Characteristics of rumen fermentation and blood metabolites
The result of ruminal pH, NH3-N, and BUN affected by MOSM supplementation are presented in Table 3. Supplementation of MOSM did not affect ruminal pH and NH3-N concentrations (p>0.05), while BUN concentrations were decreased quadraticly (p<0.05) when goats were fed MOSM with 2.4% of total DM intake. The effect of MOSM supplementation on ruminal VFA concentrations is presented in Table 4. The concentrations of total VFA, acetate and butyrate were similar among treatments (p>0.05), while propionate was increased linearly by MOSM supplementation (p<0.05). Furthermore, the calculated production of ruminal CH4 was decreased linearly (p<0.05) when goats were fed MOSM at 1.6% and 2.4% of total DM intake.
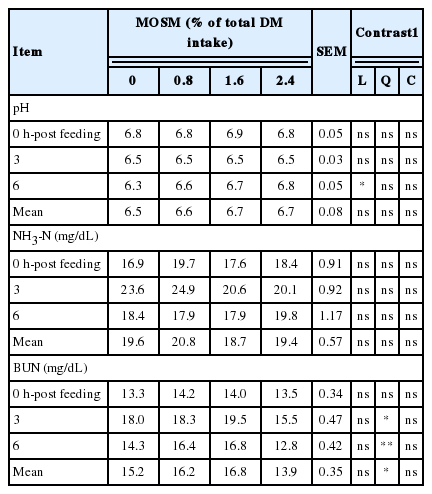
Effect of mao seed meal supplementation on rumen pH, NH3-N and BUN in goats

Effect of mao seed meal supplementation on VFA concentration and CH4 production in goats
Rumen microorganism populations
Table 5 presents information on the rumen microorganism population as influenced by MOSM supplementation. The population of bacteria, holotrich protozoa, entodiniomorph protozoa and total protozoa counts were unaltered by dietary treatments (p>0.05)
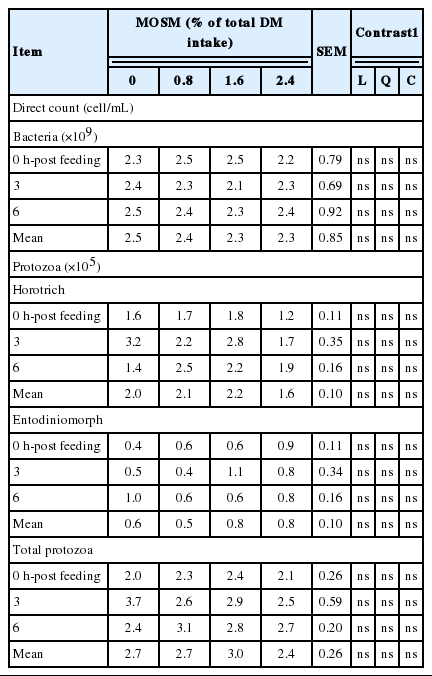
Effect of mao seed meal supplementation on ruminal microbes in goats
Nitrogen utilization and microbial protein synthesis
Table 6 presents the results of N utilization and microbial CP synthesis of goats as influenced by MOSM supplementation. Total N intake was not different among treatments (p>0.05) and ranged from 10.5 to 11.1 g/d. Fecal N excretion, and N absorption were not affected by MOSM supplementation (p>0.05). The amount of N excreted in the urine and total N excretion were decreased linearly (p<0.01) with MOSM supplementation at 1.6% and 2.4% of total DM intake. Moreover, N retention and N retention to N intake ratios were increased linearly (p<0.05) when goats were fed with MOSM at 1.6% and 2.4% of total DM intake. PD excretion, microbial N supply, microbial CP synthesis and EMNS were not significantly affected by dietary treatments (p>0.05).
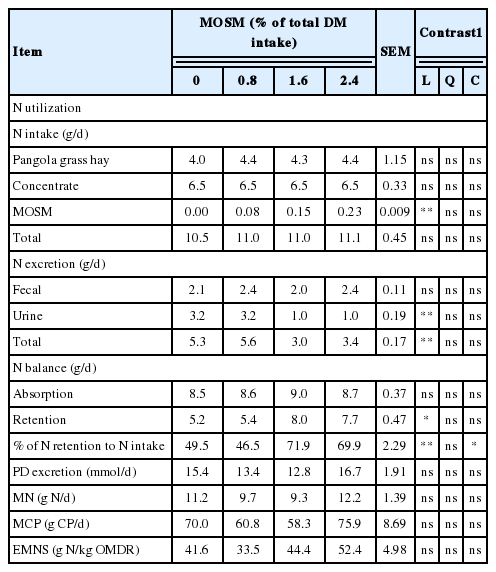
Effect of mao seed meal supplementation on N utilization and microbial protein synthesis in goats
DISCUSSION
Supplementation of tannin containing plants to ruminant diets usually reduces feed intake because of reduced palatability, decreased rate of digestion and development of conditioned aversion (Mueller-Harvey, 2006). Beauchemin et al. (2008) reported that feed intake was reduced by high doses (>50 g/kg DM) of CT uptake. The negative effect of CT on feed intake was caused by astringency of CT and short-term post-ingestive malaise (Landau et al., 2000). However, in the present study, dietary tannins sources had no effect on total DM intake and nutrient intakes when used at a suitable level (<50 g/kg DM) as a supplement.
Significant differences in ruminal pH between control and treatments occurred at 6 h-post feeding. The ruminal pH in control was significantly lower than those of treatment group. However, mean ruminal pH was not altered by dietary treatments and was in optimal range for the ecology and fermentation by microbes as reported by Gunun et al. (2013). Rumen NH3-N concentrations varied in response to feeding, especially at the peaks occurring at 3 h post-feeding. Concentration of NH3-N in the rumen fluid is the net result of NH3-N production from the feed, fermentation of protein, absorption through the rumen wall and passage out of the rumen and utilization by microbes. Rumen NH3-N concentration averaged 19.6 mg/dL for dietary treatments, a value that is close the optimal concentration of 15 to 30 mg/dL of NH3-N as an optimal level for microbial growth in tropical conditions (Wanapat and Pimpa, 1999). When a CT containing plant is masticated, insoluble CT-protein complexes are formed; these are stable over the pH range 3.5 to 7.0 but dissociate in the abomasum and duodenum, hence decreasing ruminal CP degradation and NH3-N concentrations (Makkar, 2003). However, reactivity between CT and proteins depends partly on the molecular weight, type of tertiary structure, and amino acid content of proteins. In the present study, ruminal NH3-N concentrations and microbial CP synthesis were not significantly affected by dietary treatments. A possible explanation for this is that CT in MOSM may not affect the protein degradability. This is in agreement with Animut et al. (2008) who reported that rumen NH3-N concentrations were not affected by varying source of CT in goats. Moreover, BUN is an indicator of protein degradation in the rumen (Pathak et al., 2013). In the current study, BUN was decreased when goats were fed with MOSM at 2.4% of total DM intake. Higher CT in MOSM may have further reduced availability of degradable protein in the rumen, resulting in a further decrease in BUN concentrations. The results from the present study were similar to those of Dey et al. (2008), who reported that BUN concentrations was decreased by supplementation of CT from Ficus infectoria leaves at 1.5% and 2.0% in lambs.
Propionate formation can be considered as a competitive pathway for CH4 production (Moss et al., 2000). The increase of propionate in the supplemented groups led to the reduction of calculated CH4 production in this study. The CT suppressed CH4 production by shifting hydrogen (H2) from the CH4 pathway to produce propionate (Wanapat et al., 2014). Simailarly, Animut et al. (2008) reported that propionate was increased, while CH4 was decreased by supplementation with CT containing forage, Kobe lespedeza, in goats. Our previous study (Gunun et al., unpublished) showed that supplementation of mao pomace containing CT could reduce CH4 production up to 40% in in vitro. The present study showed the reduction of CH4 by MOSM without affecting total DM intake. However, total VFA, acetate and butyrate were similar among treatments. The results from the present study were similar to the report of Wanapat et al. (2014) that VFA production and C2:C3 were not affected by mangosteen peel containing CT, possibly due to lack of effect of supplemented CT on bacteria or to adaptation of rumen microorganisms to CT (Patra and Saxena, 2011).
The total direct count is a traditional method and may not reflect accurately bacteria in the rumen, especially bacteria attached to plant particles. In future studies, quantitative polymerase chain reaction (qPCR) method will need to be used to more accurately measure the number of total bacteria. Effects of CT on rumen protozoa are variable and mostly depend on the type of CT, their origin and supplementation levels (Patra and Saxena, 2011). In the present study, total bacteria, total protozoa, horotrich and entodiniomorph counts were not affected by MOSM supplemention. Similarly, Animut et al. (2008) established that CT in Kobe lespedeza was not responsible for the anti-protozoal activity in goat. In contrast, Gunun et al. (2014) reported that protozoal population was dramatically decreased with MOSM supplementation in in vitro.
In the present study, supplementation with MOSM did not affect digestibility of CP. These results contrast with those of Soltan et al. (2013) who reported a decrease in apparent N digestibility due to higher fecal N excretion in the presence of CT. These authors suggested that higher faecal N excretion in the presence of active tannins was matched by lower urinary N excretion due to the lower degradability of protein in the rumen and subsequent lower NH3-N absorption. This shift in N excretion routes was not relevant in our experiment since no significant differences were observed in fecal N excretion. However, urinary N excretion was lower, which resulted in higher N retention when goats were fed with MOSM at 1.6% and 2.4% of total DM intake. The reduction in urinary N in our study was 68.8% by MOSM compared to control. A possible explanation for this is that CT in MOSM was increased rate of recycling N into the rumen, presumable as saliva urea. Similar to the present study, increased N retention in goat given plants-containing CT due to lowered nitrogen excretion through urine has been reported earlier by several workers (Pathak et al., 2013).
Urinary PD excretion is often used to estimate ruminal microbial protein synthesis in ruminants. The principle is that duodenal purine bases, as a microbial marker, are efficiently absorbed at the small intestine and the majority of their metabolites excreted via kidney with a specific urinary recovery in each animal species. Allantoin was the major PD, accounting for 78% to 85% of total PD (Hernandez et al., 2014). In the present study, PD excretion was not affected by MOSM supplementation. Microbial CP synthesis in the rumen provides the majority of protein supplied to small intestine of ruminants, accounting for 50% to 80% of total absorbable protein. Supplementation with MOSM did not affect microbial CP synthesis. Moreover, total protozoa counts were not affected by MOSM supplementation compared with the control. Thus it seems unlikely that the protozoa substantively contributed to the estimated increase in duodenal flow of microbial N as estimated from the urinary excretion of PD. The results from the present study were similar to those of Dentinho et al. (2014), who reported that microbial N supply and protozoa counts were unaffected by Salix babylonica and Leucaena leucocephala leaf extracts in lambs. The microbial CP flows from the rumen as calculated from PD excretion using the equation of Chen and Gomes (1995) were 70.0, 60.8, 58.3, and 75.9 g CP/d when goats were fed with MOSM at 0%, 0.8%, 1.6%, and 2.4% of total DM intake, respectively.
CONCLUSIONS
Supplementation of MOSM at 1.6% to 2.4% of total DM intake resulted in increased VFA production especially propionate, N balance through reducing N losses in urine and reduced CH4 production, while it did not adversely affect feed intake, digestibility, microbial populations and microbial protein synthesis in goats.
ACKNOWLEDGMENTS
The authors would like to express their most sincere gratitude and appreciation to the Program in Animal Production Technology, Faculty of Technology, Udon Thani Rajabhat University for the use of the research facilities. The cooperation of J. Jantapong, S. Sangkaew, and P. Thattamlay whom participated in this study and the Department of Animal Science, Faculty of Natural Resources, Rajamangala University of Technology-Isan, Sakon Nakhon Campus was highly appreciated.
Notes
CONFLICT OF INTEREST
We certify that there is no conflict of interest with any financial organization regarding the material discussed in the manuscript.