Effects of Candida norvegensis Live Cells on In vitro Oat Straw Rumen Fermentation
Article information
Abstract
This study evaluated the effect of Candida norvegensis (C. norvegensis) viable yeast culture on in vitro ruminal fermentation of oat straw. Ruminal fluid was mixed with buffer solution (1:2) and anaerobically incubated with or without yeast at 39°C for 0, 4, 8, 16, and 24 h. A fully randomized design was used. There was a decrease in lactic acid (quadratic, p = 0.01), pH, (quadratic, p = 0.02), and yeasts counts (linear, p<0.01) across fermentation times. However, in vitro dry matter disappearance (IVDMD) and ammonia-N increased across fermentation times (quadratic; p<0.01 and p<0.02, respectively). Addition of yeast cells caused a decrease in pH values compared over all fermentation times (p<0.01), and lactic acid decreased at 12 h (p = 0.05). Meanwhile, yeast counts increased (p = 0.01) at 12 h. C. norvegensis increased ammonia-N at 4, 8, 12, and 24 h (p<0.01), and IVDMD of oat straw increased at 8, 12, and 24 h (p<0.01) of fermentation. Yeast cells increased acetate (p<0.01), propionate (p<0.03), and butyrate (p<0.03) at 8 h, while valeriate and isovaleriate increased at 8, 12, and 24 h (p<0.01). The yeast did not affect cellulolytic bacteria (p = 0.05), but cellulolytic fungi increased at 4 and 8 h (p<0.01), whereas production of methane decreased (p<0.01) at 8 h. It is concluded that addition of C. norvegensis to in vitro oat straw fermentation increased ruminal fermentation parameters as well as microbial growth with reduction of methane production. Additionally, yeast inoculum also improved IVDMD.
INTRODUCTION
Agricultural by-products, such as cereal straw from oats, wheat, and corn, constitute a great potential source of ruminant feed energy. Straws have low nutritional value, because of their low nitrogen and high indigestible fiber content. In recent years, yeast-based additives, primarily Saccharomyces cerevisiae (S. cerevisiae), have been used to increase rumen feed utilization efficiency (Williams et al., 1991; Miller-Webster et al., 2002; Lila et al., 2004; Doležal et al., 2011; Chaucheyras-Durand et al., 2012). The beneficial effects associated with S. cerevisiae in animal studies include a greater dry matter (DM) and neutral detergent fiber digestibility. (Plata et al., 1994), as well as a higher feed utilization and milk production (Moallem et al., 2009). In vitro studies have also shown that yeast cultures favourably alter microbial fermentation (Marrero et al., 2013; Ye et al., 2014) and stimulate DM and cellulose digestion (Miller-Webster et al., 2002; Lila et al., 2004; Tang et al., 2008). In the same way, Marrero et al. (2015) showed that inclusion of two strains of yeast (Levazot 15 and Levica 25) in the in vitro fermentation of oat straw the accumulated gas production had a twofold increase as a result of yeast effect compared to control. Similar findings were reported by Marrero et al. (2014) when a yeast culture (Levica 27) was included in the fermentation of corn stover. Aldo et al. (2006) also reported significant increases in the in vitro forage degradabilty when rice bran was treated with Candida utilis attributing this to the stimulation of rumen microbes by yeast. However, studies examining yeast cultures other than S. cerevisiae as rumen feed additives are scarce (Shin et al., 2002; Oeztuerk et al., 2005; Ando et al., 2006). In a previous study, Castillo (2009) isolated and identified the yeast Candida norvegensis and demonstrated the favourable effect of a non-Saccaromyces yeast addition on some fermentative parameters, such as gas production. The aim of the current experiment was to investigate the inoculation of a yeast (Candida norvegensis) and the effects on the in vitro ruminal fermentation of oat straw.
MATERIALS AND METHODS
Additives and Substrates
The yeast strain Levazoot 15 (Candida norvegensis) from the UACH yeast collection was used, with record number of the Gen Bank: JQ519367.1 GI: 386785959, was obtained in a previous study (Castillo, 2009) when the yeast was selected, isolated and identified from the rumen environment of dairy cows. Yeast strain samples from a culture of the Candida norvegensis strain were plated on malt extract broth and incubated for 20 h at 30°C±2°C. The probiotic was prepared by placing 30 mL of this inoculum into 1,200 mL of malt extract broth at identical conditions and incubation time, and containing 2.5×10⁸ live organisms/mL. Oat straw was used as substrate on a DM basis for in vitro incubation. The oat straw had been ground in a Wiley mill (Thomas-Wiley Model 4 Thomas Scientific, Swedesboro, NJ, USA) to pass through a 1 mm screen. The chemical composition of the cow’s diet and the oat straw are shown in Table 1.
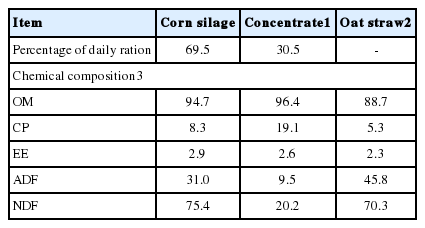
Chemical composition of feedstuffs
In vitro batch fermentation
Two cannulated lactating Holstein dairy cows (550± 25.5 kg BW) were fed twice daily with 4.0 kg of a mix grain and 4 kg of corn silage (DM basis) (Table 1), and used as donor animals for ruminal liquor. The ruminal liquor was drawn before feeding (0600) from each cow with a vacuum pump and deposited in a 2-L hermetically sealed insulated flask that had been brought to the proper temperature and flushed with CO2, and immediately taken to the laboratory. The mixed sample was strained through several layers of surgical gauze into a 1-L Erlenmeyer flask. The buffer solution had the following composition in 1.0 L: 9.8 g of NaHCO3, 7 g of Na2HPO4.7H2O, 0.57 g of KCl, 0.47 g of CaCl2, 0.12 g of MgSO4.7H2O, 0.917 g of urea, and 0.917 g of glucose. The entire procedure was conducted under a CO2 atmosphere to ensure anaerobic conditions and efforts were made to keep the temperature at 39°C. For each sample, 50 mL of filtered rumen fluid and 100 mL of buffer solution were mixed in a 1:2 ratio. After mixing, 120 mL of diluted ruminal fluid was transferred under anaerobic conditions to 250 mL serum bottles containing 1.5 g of the substrate (oat straw) on a DM basis. Forty bottles were anaerobically sealed with butyl rubber stoppers and capped with aluminium. One set of 20 bottles, the control, was incubated at 39°C for 24 h with shaking at 30 rpm (New Brunswick Model Innova 4000, Nijmegen, Netherlands) and each bottle contained only the filtered rumen liquor and buffer solution. The remaining bottles (20) contained the same medium and was inoculated with 30 mL of the yeast probiotic and were incubated under identical conditions as the control group. Five sample times were set, 0, 4, 8, 12, and 24 h, (except for methane at 36 h) from the start of fermentation, with four repetitions for each time point. Consequently, the fermentation was conducted in a total of 40 bottles.
Microbiological determination
At every incubation time, 1 mL samples were collected to determine colony forming units (Log10 colony-forming unit [CFU])/mL) of cellulolytic bacteria, cellulolytic fungi, and yeast using the Hungate (1969) culture roll-tube technique under strict anaerobic conditions. The cellulolytic bacteria were grown in culture media as described by Caldwell and Bryant (1966) with the modification described by Elías (1971). Dilutions of 103, 104, and 105 were used to cultivate the bacteria and the fungi. The same dilutions were used for the fungi, and the culture media used was as specified by Joblin (1981). For the yeasts, malt extract agar was utilized with 0.01 g/L of chloramphenicol and three dilutions were used, 104, 105, and 106. The number of CFU was determined by visual inspection of colonies on the tube rolls under a magnifying glass.
Analyses
At the end of incubation methane gas was measured according to Theodorou et al. (1994), and total gas was measured by inserting a needle connected to a pressure transducer (Festo Co. Chihuahua, Chih. Mexico) where amount of gas was recorded and collected in a previously sealed tube using a 50-mL syringe. Tubes were retained and methane was measured by gas chromatography (Pye Unicam LTD, Cambridge, UK) using a flame ionization detector. The carrier gas was nitrogen, temperature of furnace was 52°C and detector temperature was 230°C. Silica gel columns were utilized. Methane concentration produced in each fermentation was calculated according to the general equation of gases (N = PV/RT). Atmospheric pressure was 10.1×10⁴ Pa and room temperature was 299.5°K. The pH was immediately determined after bottles were uncapped with a portable pH meter (Hannah Instruments, Model HI 9017, Arvore-Vila do Conde, Portugal). Lactic acid (LA) concentrations (μg/mL) were determined by a colorimetric method. as described by Taylor (1996). For analysis of ammonia nitrogen (mMol) and volatile fatty acids (VFA) (mMol), 1 mL of 25% meta-phosphoric acid (wt/vol) was added to 5 mL of fermentation fluid and was stored at −20°C. The NH3-N was determined by the colorimetric method of Broderick and Kang (1980) using a spectrophotometer (Hach DR500, Loveland, CO, USA). After thawing, 1 mL of fermentation fluid was centrifuged (10,000×g for 10 min) and VFA levels (mMol) were determined by gas chromatography (Perkin Elmer Model Clarus 800, Perkin Elmer Inc., Waltham, MA, USA) using a column (30 m×0.32 mm i.d.) and a flame ionization detector (column temperature 180°C, detector temperature 320°C, and injector temperature 240°C). The carrier gas was hydrogen with a flow rate of 1.40 mL/min. For in vitro DM disappearance (IVDMD) was determined according to Capetillo et al. (2002). the bottles’ contents were transferred into test tubes (20 cc) previously dried at 105°C and centrifuged at 1,000×g for 5 min and the pellets were dried at 55°C for 48 h. The IVDMD was calculated by subtracting the dry residue weight (pellet) from the original weight of oat straw divided by the original sample weight, and the values multiplied by 100 to derive the percentage of IVDMD.
Statistical analysis
An analysis of variance was performed with the PROC MIXED procedure of SAS. (2002) (SAS Inst., Inc., Cary, NC, USA). The adjusted model included the fixed effects of yeast strain treatment and the control group, fermentation time, and the interaction between treatment and the time effect.
The model as fitted was as follows:
where Yijk = the dependent variable; μ = overall mean; Ti = treatment effect (i = 1,2); Mj = Time effect (j = 1,2,3,4,5); L×M(ij) = Interaction effect, and ɛijk = random residual error.
The identity of the nested balloon flask (experimental unit) was used in the treatment as a random effect. A trend analysis was performed on the variables across fermentation times in each treatment group, using fermentation time as an indicator variable. Mean values are reported with standard errors, and p-values are declared statistically different when p<0.05 or as indicated. Comparison of means were made using the predicted difference procedure of SAS (2002).
RESULTS AND DISCUSSION
pH value and lactic acid content
As shown in Table 2, the pH and LA concentrations in the medium decreased quadratically over time (p<0.01 and p<0.02, respectively). Treatment with yeast reduced pH relative to controls at all fermentation times (p<0.01). Williams et al. (1991) reported similar results; they observed decreased pH when S. cerevisiae (10 g/d) was added to oat hay diet of young bulls. and by Lynch and Martin (2002), who studied the in vitro effect of S. cerevisiae on fermentation of Bermuda hay and alfalfa hay. Lila et al. (2004), Oeztuerk et al. (2005), Lattimer et al. (2007), Longuski et al. (2009), and Inal et al. (2010), reported in vitro studies where pH remained unchanged. LA concentration in the yeast treatment was lower than the control group at 12 h of fermentation (p<0.05). At 24 h, the reduction was not statistically significant, although there was an appreciable numerical difference. These results confirmed findings by Williams et al. (1991), Erasmus et al. (1992), and Lila et al. (2004) who reported that the presence of yeast significantly reduced rumen LA concentrations and this reduction could be attributed to yeast cells stimulating the activity of Selenomona ruminantum, which consumes LA and thus contributes to pH stabilization.
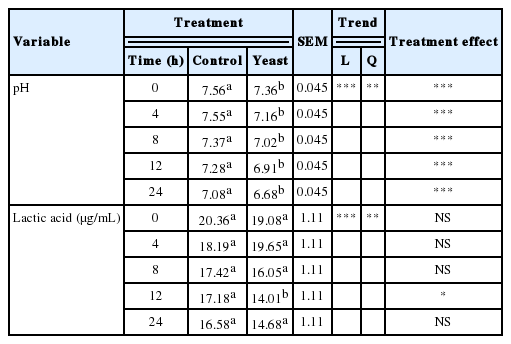
Least squares means (±SE) of pH and lactic acid during in vitro oat straw rumen fermentation
Ammonia nitrogen concentration
The concentrations of ammonia-N (Table 3) increased quadratically with time of fermentation (p<0.01). Yeast treatment reduced ammonia-N concentrations in the medium at 4, 8, 12, and 24 h. These results agreed with those of Erasmus et al. (1992) and Moallem et al. (2009) who found significant ammonia-N concentration decreases when yeast was added to dairy cow diets. Chaucheyras-Durand and Fonty (2001) also reported that ammonia-N concentrations decreased when yeast was added to alfalfa hay and feeds for growing sheep. This ammonia-N reduction may be due to higher ammonia intake by microbial cells, perhaps as a direct result of stimulation of rumen microbial activity (Williams and Newbold, 1990).
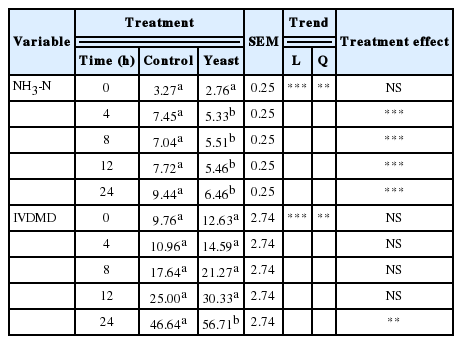
Least squares means (±SE) of ammonium nitrogen and in vitro dry matter disappearance during in vitro oat straw rumen fermentation
Percentage of in vitro dry matter digestibility
As shown in Table 3, oat straw IVDMD increased quadratically with greater fermentation time (p<0.02). Yeast treatment only increased IVDMD relative to controls at 24 h (p<0.01), in agreement with in vitro results reported by Miller-Webster et al. (2002) and Lila et al. (2004). Williams et al. (1991) reported that stimulation of cellulose degradation by yeast cultures is associated with a decrease in the lag phase, which also causes an initial increase in digestion rate. These authors also attributed the improvement in DM digestibility to pH stabilization. Ando et al. (2004) as well, reported an increment in the total degradability of forage when they added dried beer yeast attributing it to the activation of rumen microbes and partially due to the addition of nitrogen sources. Newbold et al. (1995) reported that some yeast cultures increased total and cellulolytic bacterial counts in the rumen, thus increasing fibre digestion. Another explanation may be that yeast cells in the rumen produce ethanol (Kung et al., 1997), which is converted by rumen microorganisms into valeric and isovaleric acids. The increases in these acids that were observed with the yeast treatment in this study are consistent with this latter possibility (Table 4). Valeric, capric, isobutyric, and isovaleric acids were found to stimulate rumen cellulolysis in studies involving fractional distillation of the rumen fluid (Elias, 1983). Likewise, in our study, higher concentrations of valeric and isovaleric acids were associated with increased rumen cellulolysis and in vitro disappearance of DM. The molar concentrations of acetic (p<0.01), butyric (p<0.01), propionic (p<0.01), valeric (p<0.01), and isovaleric acids (p<0.02) increased linearly over fermentation times (Table 4).

Least squares mean (±SE) of concentrations of acetic, propionic, butyric, valeric and isovaleric acids during in vitro oat straw rumen fermentation
Acetic acid content
In the present study (Table 4), acetic acid concentrations were higher in the yeast treatment groups than in the controls at 8 h (p<0.01) and 12 h (p<0.01). Propionic acid was lower when yeast was added at 0 h (p<0.03), but higher at 8 h (p<0.03) and 12 h (p<0.02). Meanwhile, butyric acid concentration was also lower at 0 h and higher at 8 h with yeast treatment. Valeric and isovaleric acid concentrations with yeast treatment were higher than that in control solutions at 8, 12, and 24 h (p<0.01). Oeztuerk et al. (2005) studied the effects of live yeast on in vitro rumen fermentation of a hay and grain diet and found that acetic, butyric, valeric, and isovaleric acids increased, while only propionic acid did not increase significantly. Similar results were found by Erasmus et al. (2005); Miller-Webster et al. (2002). Diaz et al. (2011); Křižova et al. (2011); Kowalik et al. (2012). The stimulating effect of the strain under study on production of VFAs may be related to the chemical composition of the yeast cell wall and other cell components. Yeast cell walls, which account for ~20% of the yeast cell weight, are primarily made up of β-1.3 and β-1.6 glucans, and chitin (Moukadiri et al., 1997). These structures, which form appropriate substrates for microbial rumen fermentation, independent of the state of the yeast (Oeztuerk et al., 2005).
Microorganisms counts
Table 5 shows the resulting CFU counts in viable yeast, cellulolytic bacteria, and cellulolytic fungi in the rumen. The quantity of viable yeast inoculated into the rumen decreased linearly with fermentation time (p<0.01, Table 5). Similar results were reported by Arambel and Rung-Syin (1987) in studies examining the growth of S. cerevisiae in a ruminal environment. These authors indicate that yeasts are incapable of sustaining a productive population within a ruminal environment, because of inhibiting factors for yeast growth, such as non-optimal temperature. The optimal temperature range for yeast growth is 28°C to 30°C, with survival remaining possible up to 37°C through formation of ascospores (Dengis et al., 1995). At 39°C, the typical temperature in the ruminal environment, growth and viability are reduced. (Mendoza, 1993). Williams et al. (1990) postulated that yeast do not establish themselves permanently in the rumen. In the current study, the inoculated rumen materials maintained a higher yeast population than the control for up to 12 h (p<0.01), and was not significantly different until 24 h post-inoculation. After 12 h, the yeast cells entered a lethal no-growth phase, which corroborates the hypothesis of Williams et al. (1990). Also it was observed that, after 12 h, the differences in yeast populations between the inoculated and control samples were smaller, reaching a nadir at 24 h. In the present study, rumen material was tested for resident yeast soon after collection, and it was demonstrated that a pool of yeast populations existed in the rumen. Fermentation and treatment time did not affect cellulolytic bacterial counts (p<0.05) (Table 5). The effects of live yeast on cellulolytic bacterial counts are very diverse. Similar to the present findings, Erasmus et al. (1992) found no effect of S. cerevisiae on the cellulolytic bacterial populations of dairy cows fed an energy-rich diet. Conversely, Newbold et al. (1996) and Lila et al. (2004) reported a positive effect of adding yeast cultures to in vitro fermentation of hay and concentrate mixes. Counts of cellulolytic fungi (Table 5) did not exhibit any trends across the fermentation times. However, treatment with yeast cultures positively affected cellulolytic fungal populations in the rumen after 4 h (p< 0.01) and 8 h (p<0.01) of fermentation. Chaucheyras et al. (1995) also report that yeast stimulate the growth of the ruminal fungus Neocallimastix frontalis. This stimulation effect on ruminal microorganisms, particularly on those that break down cellulose, such as cellulolytic fungi, may be explained by specific mechanisms of action in the rumen. When yeast are plasmolized, over time they supply growth factors such as peptides, amino acids, B-complex vitamins, and other components that favour bacterial and fungal growth (Elías, 1971). Also, live yeast help to eliminate a small amount of oxygen (~1%), that enters the rumen when the animal ingests feed, through aerobic respiration, and this process facilitates growth of more stringent anaerobic microorganisms, such as cellulolytic bacteria and fungi (Newbold et al., 1996).
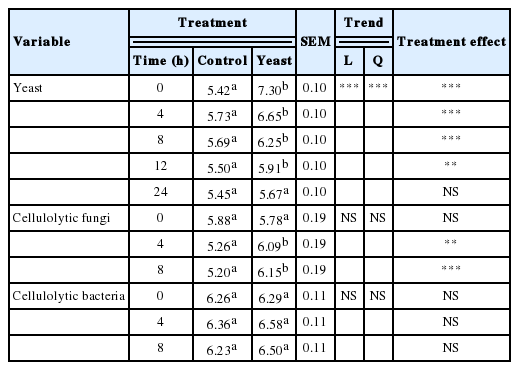
Least squares mean (±SE) of yeast and microorganism counts during in vitro oat straw rumen fermentation
Methane production
As shown in Table 6, methane production did not exhibit any trends across fermentation times. A reduction in methane production was observed only at 8 h by yeast treatment (p<0.01). At other time points, there were noticeable numerical decreases, although not statistically significant. Numerous studies have demonstrated that methane production is affected by addition of yeast. Mutsvangwa et al. (1992) observed a marked decrease in methane production with the addition of S. cerevisiae in intensive fattening of bulls. Lynch and Martin (2002) and Lila et al. (2004) also found reduced methane production when they studied the behaviour of yeasts added to in vitro fermentation of alfalfa hay and hay-concentrate mix. This drop in methane production may be due to the yeast stimulating utilization of metabolic hydrogen by acetogenic bacteria in the generation of acetic acid. (Chaucheyras et al., 1995). Based on the above results, addition of the yeast Candida norvegensis to in vitro oat straw fermentation positively influenced ruminal fermentation parameters as well as microbial growth with reduction of methane production. Additionally, yeast inoculum also improved IVDMD.

Least squares mean (±SE) of methane production during in vitro oat straw rumen fermentation
Notes
CONFLICT OF INTEREST
We certify that there is no conflict of interest with any financial organization regarding the material discussed in the manuscript.