Proteomic Analysis of Bovine Pregnancy-specific Serum Proteins by 2D Fluorescence Difference Gel Electrophoresis
Article information
Abstract
Two dimensional-fluorescence difference gel electrophoresis (2D DIGE) is an emerging technique for comparative proteomics, which improves the reproducibility and reliability of differential protein expression analysis between samples. The purpose of this study was to investigate bovine pregnancy-specific proteins in the proteome between bovine pregnant and non-pregnant serum using DIGE technique. Serums of 2 pregnant Holstein dairy cattle at day 21 after artificial insemination and those of 2 non-pregnant were used in this study. The pre-electrophoretic labeling of pregnant and non-pregnant serum proteins were mixed with Cy3 and Cy5 fluorescent dyes, respectively, and an internal standard was labeled with Cy2. Labeled proteins with Cy2, Cy3, and Cy5 were separated together in a single gel, and then were detected by fluorescence image analyzer. The 2D DIGE method using fluorescence CyDye DIGE flour had higher sensitivity than conventional 2D gel electrophoresis, and showed reproducible results. Approximately 1,500 protein spots were detected by 2D DIGE. Several proteins showed a more than 1.5-fold up and down regulation between non-pregnant and pregnant serum proteins. The differentially expressed proteins were identified by MALDI-TOF mass spectrometer. A total 16 protein spots were detected to regulate differentially in the pregnant serum, among which 7 spots were up-regulated proteins such as conglutinin precursor, modified bovine fibrinogen and IgG1, and 6 spots were down-regulated proteins such as hemoglobin, complement component 3, bovine fibrinogen and IgG2a three spots were not identified. The identified proteins demonstrate that early pregnant bovine serum may have several pregnancy-specific proteins, and these could be a valuable information for the development of pregnancy-diagnostic markers in early pregnancy bovine serum.
INTRODUCTION
The bovine pregnancy was detected routinely by palpation per rectum at 60 days after at artificial insemination (AI) or ultrasonography at 35 days after AI (Oltenacu et al., 1990; Nation et al., 2003). Progesterone concentration in milk has also become a method for detection of bovine pregnancy (Pyo et al., 2003). The early pregnant cows have numerous signals such as steroids, prostaglandins, and many protein factors (Bartol et al., 1985; Knickerboker et al., 1986). These proteins produced by uterus and placenta have been used to detect pregnancy for many years in other species (Yuan et al., 2006). More recently, pregnancy-specific protein B, which is a placental glycoprotein (Butler et al., 1982; Sasser et al., 1989) has been measured by radio-immnunoassay method (Sasser et al., 1986; Perenyi et al., 2002) in serum of pregnant cow. For development of any marker proteins from complex biological fluids, such as plasma, serum and urine, two-dimensional (2D) gel electrophoresis technique is routinely used in many laboratories (Bichsel et al., 2001; Zhou et al., 2002; Morita et al., 2006). In addition, Bovine samples have been reported by several previous studies of high-resolution 2D gel electrophoresis (Talamo et al., 2003; Berendt et al., 2005). Hochstrasser et al. (1997) had used 2 dimensional SDS-polyacrylamide gel electrophoresis (2D SDS-PAGE) technique to identify potential bovine serum encephalitis-specific markers on bovine colony stimulating factor samples. And Manabe et al. (1987) had performed a native 2D electrophoresis for mapping adult and fetal bovine plasma and serum.
The 2D gel electrophoresis technique is well known and commonly used for proteomic separation. But it requires time-consuming and labor-intensive as well as low reproducibility between gels due to comparison analysis using many gels. Thus it could be difficult to distinguish the difference among gels and induce lots of variation (Yan et al., 2002; Chromy et al., 2004; Marouga et al., 2005). Moreover, the protein visualization methods such as Coomassie brilliant blue (CBB) or silver staining are inherently variable. To improve the limitation of 2D gel method like a low reproducibility and gel to gel variation, 2D fluorescence difference gel electrophoresis (DIGE) were introduced with co-detection of up to three samples on the same single 2D gel, which could minimize the gel-to-gel variation (Raggiaschi et al., 2006).
The 2D DIGE technique was first described by Unlu group in 1997 to introduce a feature to separate more than one sample in a single 2D polyacrylamide gel. This technique involved pre-labeling two protein extracts, using two fluorescent cyanine dyes known as Cy3 and Cy5. The labeled samples were then mixed and run on the same 2D gel. Amersham Biosciences (now part of GE Healthcare) had acquired exclusive license for this technology from Carnegie Mellon University, and published firstly the study of N-acetyl-p-aminophenol toxicity in mouse liver (Anderson et al., 2001; Tong et al., 2001). More recently, Amersham Biosciences has also introduced third fluorescent dye, known as Cy2, making it possible to compare three samples on one 2D gel. The Cy2 fluorescence dye has similar properties with Cy3 and Cy5. The protein samples are then visualized by using fluorescence imaging to enable detection of differences between protein abundance in the three samples. The samples expressed by coloring in three kinds of fluorescence from protein abundance can be separated in the single gel. Three different color images can be acquired from the same gel after background subtraction and normalization. The ability to directly compare three samples on the same gel not only avoids the complications of gel-to-gel variation but also enables a more accurate and rapid analysis of differences and reduces the number of gels that need to be run. It also utilizes DeCyder (Differential Analysis Software, GE Healthcare Bio-Sciences, Uppsala, Sweden), newly developed image analysis software for DIGE for removing user subjectivity and increasing automation of the analysis.
In this study, we carried out the fluorescence 2D DIGE technique on bovine serums to identify the pregnant-specific serum proteins between pregnant and non-pregnant bovine serums, because 2D DIGE is more sensitive and reproducible than conventional 2D gel electrophoresis technique (Gharbi et al., 2001; Marouga et al., 2005).
MATERIALS AND METHODS
Serum sample preparation
Bovine serum sample
We prepared serums of 2 pregnant Holstein cattle at day 21 after AI and those of 2 non-pregnant cattlte for analyzing of proteomics. The samples were collected in Animal Research Center of Chungnam National University. After the fresh bovine blood was collected in a heparinized tube and centrifuged at 1,000×g at 4°C for 10 minute, the supernatant serum was collected and stored at −20°C until use.
Extraction of serum soluble proteins
Lysis buffer containing 0.3% SDS, 3% dithiothreitol (DTT), protease inhibitor cocktail (complete; Roche Diagnostic GmbH Inc., Mannheim, Germany), 0.5 M Tris/HCl (pH 8.5) was used for equal volume to serum (100 μL buffer/100 μL serum), and samples were sonicated for 15 seconds and then chilled on ice. The samples were shaken gently for 1 h at room temperature. Insoluble material was removed by centrifugation at 15,000×g at 4°C for 10 min. The concentration of soluble protein was determined by the 2D Quant kit (GE Healthcare Bio-Sciences, Sweden) and then final protein samples were stored in aliquot at −70°C until use.
Labeling of fluorescence CyDye
Preparation of CyDye DIGE flour stock solution
CyDye DIGE flour, minimal labeling kit, 5 nmol (Cy2, Cy3, Cy5, GE Healthcare Bio-Sciences, Sweden) was left alone 5 minutes at normal temperature in light cutoff by putting out at −20°C. The 5 μL dimethylformamide (DMF) was added to each flour tube to be with a concentration 1 nmol/μL of flours. The samples were mixed by vortex about 30 seconds and span down, and stored by wrapping with foil for light cutoff at −20°C before using.
Preparation of CyDye DIGE flour working solution
After spinning down stock flour solution, working solution of 400pmol was made for labeling 50 μg of serum protein. Working solution (5 μL) was made by adding 3 μL DMF and 2 μL stock flour solution.
CyDye labeling and experiment design
For CyDye labeling, 1 μL of Cy5 working solution (400 pmol) and 1 μL of Cy3 working solution (400 pmol) were added to two samples of bovine non-pregnant and pregnant bovine serums (50 μg), and then mixed by vortex. To make internal standard, 1 μL of Cy2 working solution was added in two sample mixture (each 25 μg) and mixed by vortex. After spinning down, it was wrapped with foil for light cutoff, and then reacted in 30 minutes by being stored into ice. The lete labeling reaction was completed by adding 1 μL Lysine solution (10 mM) and it was stored into ice after spinning down. Non-pregnant and pregnant bovine samples were classified as ‘Control’ and as ‘Treated’, respectively (Table 1). To examine the reproducibility, the experiments were repeated with four gels of non-pregnant and pregnant bovine serum samples.

The experimental design using CyDye DIGE fluor minimal dyes
Separation of proteins by 2-D DIGE
First dimensional isoelectric focusing
Immobiline DryStrips (pH 3 to 10 nonlinear (NL), pH 6 to 9, and pH 4 to 7 18 cm; GE Healthcare Bio-Sciences, Sweden) were rehydrated in rehydration buffer (6 M Urea, 2 M thiourea, 4% 3-[{3-Cholamidopropyl} dimethylammonio]-1-propanesulfonate [CHAPS]), 0.4% DTT, 2% v/v immobilized pH gradient (IPG) buffer pH 3 to 10, pH 6 to 11, and pH 4 to 7) overnight. For 2D DIGE experiment, the samples labeled by each CyDye DIGE flour (Cy2, Cy3, and Cy5), 2× buffer (2 M Thiourea, 7 M Urea, 2% pH Pharmalayte, 2% DTT, 4% CHAPS) was used. The mixed samples were loaded into the anode cup of Multiphor II IEF system (GE Healthcare Bio-Sciences, Sweden), and first dimensional isoelectric focusing was executed. First dimensional isoelectric focusing started from 100 V and gradually increased to final voltage of 8,000 V, and it was executed during total 1.5×10⁵ Vh by setting the current with maximum value of 75 μA. To make a preparative picking gel for identification of protein spots, 2 mg of preparative serum protein samples were mixed with rehydration buffer (6 M Urea, 2 M thiourea, 4% CHAPS, 0.4% DTT, 2% v/v IPG buffer pH 3 to 10, pH 6 to 11 and pH 4 to 7) to a final volume of 450 μL.
Second dimensional gel electrophoresis
For DIGE experiment, 8% to 16% linear gradient SDS polyacrylamide gel was made using low fluorescent glass plate, and general glass plate was applied for (200×250×1.0 mm) preparative gel. The equilibrated IPG strips after the first dimension electrophoresis were placed onto SDS polyacrylamide gels. The gels were placed into the Ettan DALT system (GE Healthcare Bio-Sciences, Sweden), then run at 10 mA per gel until the bromophenol blue marker dye disappeared at the bottom of the gel.
Gel staining
After the second dimensional separation was executed, the preparative picking gels were stained with colloidal CBB G-250 for picking of spots. The gels were fixed in fixation solution (40% methyl alcohol, 5% phosphoric acid) for 1 h and stained with colloidal CBB G-250 for 24 h at room temperature. Then the gel was destained in solution containing 1% acetic acid until the appropriate background was obtained.
Image analysis
Image detection of the DIGE gel
After washing low-fluorescence glass plate by distilled water cleanly, then fluorescence image was detected by using Typhoon 9410 Variable Mode Imager (GE Healthcare Bio-Sciences, Sweden) with ImageQuant Software (GE Healthcare Bio-Sciences, Sweden). Cy2 fluorescence image was detected in 488 nm laser and 520 nm BP (band pass) 40 emission filter, Cy3 fluorescence image in 532 nm laser and 580 nm BP30 emission filter, and Cy5 fluorescence image was detected in 633 nm laser and 670 nm BP30 (Alban et al., 2003; Marouga et al., 2005).
Image analysis of the 2D gels
The gel images acquired from Typhoon 9410 Variable Mode Imager with ImageQuant software were analyzed by applying DeCyder V. 5.0 Software (both from GE Healthcare Bio-Sciences, Sweden). Gel to gel matching of the standard spot maps from each gel was performed using the DeCyder biological variation analysis (BVA) module. This allowed the statistical analysis of protein abundance changes between samples. Paired Student’s t –test analysis was performed for every matched spot set. The p values less than 0.05 were considered statistically significant. The CBB stained gels were analyzed by applying ImageScanner II (GE Healthcare Bio-Sciences, Sweden) with ImageMaster 2D platinum software version 5.0 (GE Healthcare Bio-Sciences, Sweden).
Protein identification by MALDI-TOF mass spectrometer
In-gel digestion
The protein spots were excised from the preparative pick gel, sliced into 1 mm in thickness, and transferred to reaction tubes containing 200 μL washing solution (50% v/v acetonitrile, 25 mM NH4HCO3, pH 7.8). The gel particles were incubated for 30 min in washing solution to remove staining dye and dried 30 min with vacuum centrifuge. The dried gel pieces were rehydrated with 3 μL of trypsin solution (0.0012 μg/ μL in 25 mM NH4HCO3, pH 7.8) and 5 μL of 25 mM NH4HCO3 was added to tubes including the gel particles, and then incubated 37°C for overnight. After completion of the digestion, the supernatant was transferred to another new tube. To extract residual peptides, the gel particles were sonicated for 20 min at 30°C in a solution of 50% acetonitrile/0.5% trifluoroacetic acid (TFA). Extracted peptides were used for MALDI-TOF mass spectrometer (MS) analysis.
MALDI-TOF MS analysis and peptide fingerprinting
Extracted peptides from in-gel digestion were analyzed using Voyager DE-STR MALDI-TOF MS (Applied Biosystems, Foster City, CA, USA) in the delayed extraction-reflector mode and standard conditions (Ndimba et al., 2005). Approximately 1 μL of extracted peptide solution from each gel spot piece, together with the same volume of matrix solution (10 mg/mL α-ciano-4-hydroxycinnamic acid, 0.1% v/v TFA, and 50% v/v acetonitrile), were loaded onto a 96-well MALDI sample plate and crystallized. Spectra were automatically calibrated upon acquisition, using an external three-point calibration. Peak assignment was performed manually using DataExplorer software, which is part of the Voyager-DE STR MALDI-TOF-MS software package (PerSeptive Biosystems, Framingham, MA, USA). Spectra were saved as peak table files (*.pkt) to search against non-redundant protein sequence database on the internet (SWISS-PROT, NCBInr (2010/05/01) Data Bank). The peptide mass fingerprint data were applied to ProFound search engines (http://prowl.rockefeller.edu/prowl-cgi/profound.exe). Search parameters were other mammalia as taxonomy, trypsin as an enzyme, carbamidomethylation of cystein as fixed modification and methionine oxidation as variable modification, and one missed cleavage site with a mass tolerance of less then 500 ppm. The protein identification was further validated by ProFound score, sequence coverage and number of peptides matched.
RESULTS AND DISCUSSIONS
The protein profiles of bovine serum on 2D DIGE gels
In order to compare protein expression patterns of pregnant (21 days) and non-pregnant bovine serums, the serum samples were labeled with fluorescence CyDye DIGE flour (Cy2, Cy3, and Cy5). After executing isoelectric focusing (IEF) using pH 3 to 10 NL, pH 6 to 9 and pH 4 to 7 IPG strip gels by mixing three samples labeled with fluorescence CyDye DIGE flour, they were separated in 8% to 16% polyacrylamide gradient gel for SDS-PAGE. Three images per gel were visualized by Typhoon, a fluorescence image analyzer, and ImageQuant software. The protein patterns were detected to colors of blue (Cy2, Internal standard), green (Cy3, pregnancy), and red (Cy5, non-pregnancy) by fluorescence CyDye DIGE flour. Expression pattern of proteins were observed by comparing protein spots which were expressed in serum of pregnant bovine and non-pregnancy bovine by using DeCyder Software V5.0 (GE Healthcare Bio-Sciences, Sweden) for three image gels from one gel (Figure 1A, B, C, and D).
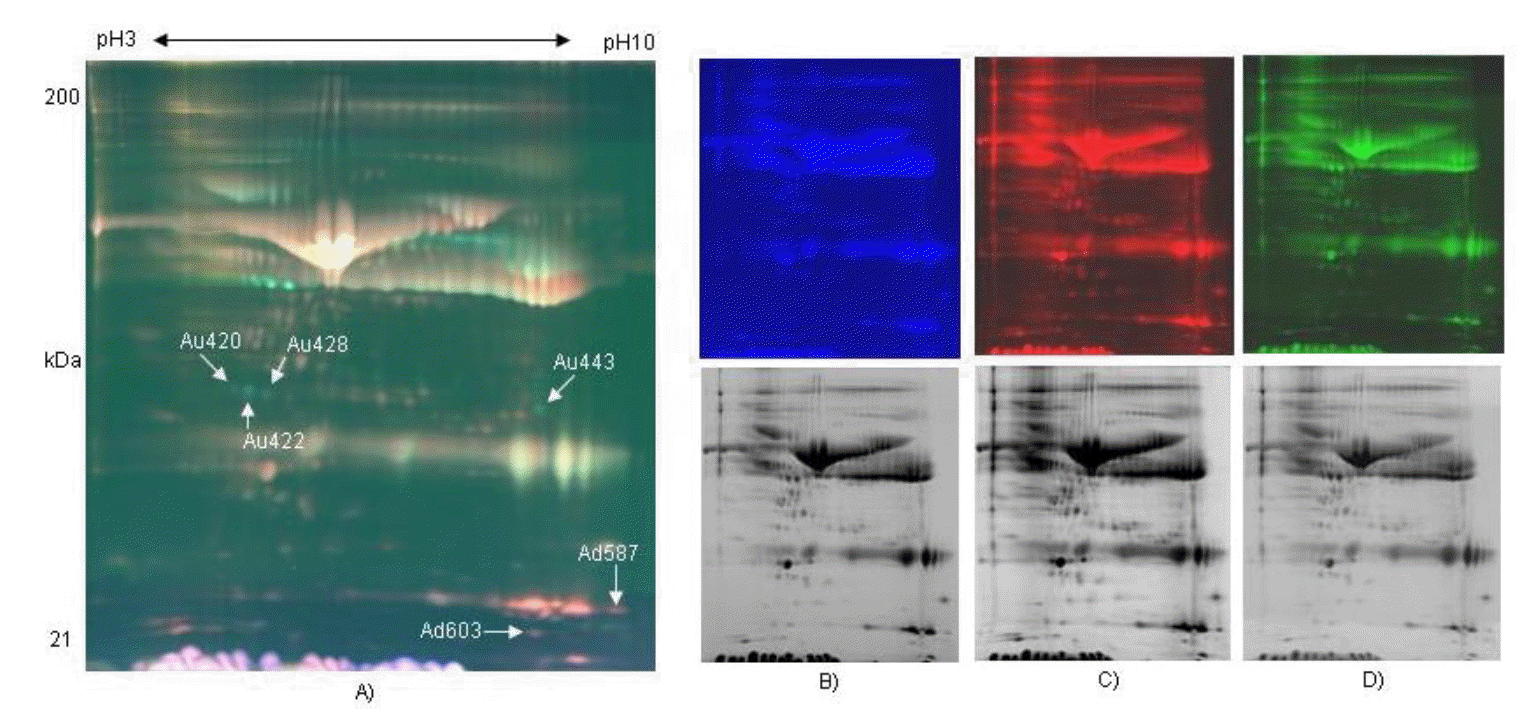
Two dimensional-fluorescence difference gel electrophoresis (DIGE) gel of bovine serum proteins labeled with CyDyes. The protein extracted from the bovine serum of pregnant and non-pregnant as visualized by CyDye DIGE flour. First dimension was pH 3 to 10 NL IPG gel and second dimension was a range of 10 to 200 kDa in an 8% to 16% gradient gel. Comparison of proteomes of serum sample of pregnant and non-pregnancy Holstein dairy cattle day 21 after artificial insemination (A: Image overlay, B: mixture of pregnant and non-pregnancy bovine serum labeled with Cy2 for internal standard, C: non-pregnant serum labeled with Cy5 for Control, D: 21 days pregnant serum labeled with Cy3). NL, nonlinear. (Upper: fluorescence color images, lower: black and white-transformed images).
Approximately 1,500 spots were detected by DeCyder differential in gel analysis module in 2D gel of pH 3 to 10. Minimal filtering was performed to eliminate dust particles etc, whilst avoiding the exclusion of potentially valuable protein spots. Gel to gel matching of the standard spot maps from each gel was performed using the DeCyder BVA module. After BVA analysis, about 600 spots were detected in 2D gel of pH 3 to 10, and they were mainly observed in molecular weight of 20 to 50 kDa (Figure 1A). A total of 6 spots were differentially distributed with at least 1.5-fold changes in volume between the non-pregnant and pregnant serum (Figure 2). Analysis of the 2D gels revealed the presence of about 630 spots in pH 6 to 9 2D gel (Figure 3A) and 770 spots in pH 4 to 7 2D gels (Figure 4A). And 6 and 2 protein spots were detected to be differentially expressed in pH 6 to 9 and pH 4 to 7 2D gels, respectively (Figure 3B and Figure 4B). These protein spots were visualized on the CBB stained preparative gels and selected for identification analysis.

Differentially expressed protein spots of pH 3-10NL. The spot pairs of up-regulated and down-regulated proteins in bovine serum were shown, with the DeCyder matched spots (NP, non-pregnancy bovine serum, P, pregnancy bovine serum). 3D representation of spot volumes derived from differentially expressed proteins. Graphical representations of all matched spots for particular protein are shown in the lower panels (dotted and solid lines were plotted with two independent values from the two sets of gels in which pregnant and normal samples ran).

2D difference gel electrophoresis gel image and differentially expressed protein spots of pH 6 to 9. The spot pairs of up-regulated and down-regulated proteins in bovine serum were shown, with the DeCyder matched spots (NP, non-pregnancy bovine serum; P, pregnancy bovine serum). 3D representation of spot volumes derived from differentially expressed proteins.

Peptide mass fingerprint of spot Cu556. A) The specific up-regulated spots was expressed on 2D polyacrylamide gel electrophorysis gels in bovine pregnancy serum. B) MALDI-TOF mass spectrometer spectrum of spots.
Protein identification
The protein of interest (up- or down-regulated) was defined from the Cy3 or Cy5 images, and its corresponding spot in CBB stained preparative picking gel images were matched. The protein spots were excised manually and subjected to in-gel digestion and analyzed with MALDI-TOF MS. Raw spectra of samples were processed by DataExplorer software to remove and reduce noises and finally result in a list of monoisotopic peaks. The tryptic peptide masses were used to search for protein candidates in web-based searching software, ProFound (http://129.85.19.192/profound_bin/WebProFound.exe).
The 13 spots were identified as the known proteins in SWISS-PROT and NCBInr databases. The search results were evaluated on the basis of accepted standard that take account into the number of peptides matched to the candidate protein and the difference in the number of matched peptides between the candidate proteins and the next best fit, the coverage of candidate protein sequences by the matching peptides of the experimental and theoretical pI and Mr with values (Jensen et al., 1999). The results of the MALDI-TOF MS analysis for the identified spots were listed in Table 2. The identified proteins were conglutinin precursor, bovine fibrinogen, IgG1 heavy chain constant region, hemoglobin, complement component 3 and IgG2a heavy chain constant region. Five proteins were identified in up-regulation such as bovine fibrinogen, conglutinin precursor and IgG1 heavy chain constant region. The down-regulated proteins were hemoglobin, complement component 3, bovine fibrinogen and IgG2a heavy chain constant region. The conglutinin precursor protein (spot no.Cu556), which was specific expressed in pregnancy serum of the pH4 to 7 gel (Figure 4A, B). However, we found that the spot Cu556-1 and Cu556-2 were the same conglutinin precursor protein, even though the sequence coverage percent values revealed with 34%, 36%, and 32% difference (Table 2). Conglutinin is known to be a collectin family member protein and a part of the innate immune system (Holmskov et. al., 2003). Its function is to bind to the surface oligosaccharide of microorganisms and eliminate microorganisms by complement activation, activation of phagocytes or inhibit microbial growth. It is considered that more research should be executed further for identifying conglutinin protein function related with pregnancy and sequences of three different spots related with bovine pregnancy.

Identification of protein interest in bovine serum
ACKNOWLEDGMENTS
This work was supported by the BioGreen 21 Program of the Rural Development Administration (grant no. PJ01119601) and the Bio-industry Technology Development Program (grant no. IPET312060-5) of the Ministry for Agriculture, Food and Rural Affairs, Republic of Korea.