A Candidate Single Nucleotide Polymorphism in the 3′ Untranslated Region of Stearoyl-CoA Desaturase Gene for Fatness Quality and the Gene Expression in Berkshire Pigs
Article information
Abstract
Fatness qualities in pigs measured by the amount of fat deposition and composition of fatty acids (FAs) in pork have considerable effect on current breeding goals. The stearoyl-CoA desaturase (SCD) gene plays a crucial role in the conversion of saturated FAs into monounsaturated FAs (MUFAs), and hence, is among the candidate genes responsible for pig fatness traits. Here, we identified a single nucleotide polymorphism (SNP, c.*2041T>C) in the 3′ untranslated region by direct sequencing focused on coding and regulatory regions of porcine SCD. According to the association analysis using a hundred of Berkshire pigs, the SNP was significantly associated with FA composition (MUFAs and polyunsaturated FAs [PUFAs]), polyunsaturated to saturated (P:S) FA ratio, n-6:n-3 FA ratio, and extent of fat deposition such as intramuscular fat and marbling (p<0.05). In addition, the SNP showed a significant effect on the SCD mRNA expression levels (p = 0.041). Based on our results, we suggest that the SCD c.*2041T>C SNP plays a role in the gene regulation and affects the fatness qualities in Berkshire pigs.
INTRODUCTION
Fatness qualities are important economic traits in the field of pig breeding (Wood et al., 1999; Wood et al., 2003; Smet et al., 2004). Intramuscular fat (IMF) and fatty acid (FA) contents in pork are closely associated with the eating qualities, including tenderness and flavour (Cameron, 1990; Wood et al., 1999; Wood et al., 2003), while backfat thickness (BF) represents the lean meat production ability (Chen et al., 2002). Moreover, recent research has focused on regulations FA contents in pork (Wood et al., 2003), given that high intake of saturated FAs (SFAs) is associated with several adult human diseases (Erkkilä et al., 2008). Conversely, among the unsaturated FAs (UFAs), monounsaturated FAs (MUFAs) aid in decreasing low-density lipoprotein cholesterol, and thus, are considered beneficial for health (Bentley, 2007). The SFAs are converted into MUFAs only by stearoyl-CoA desaturase (SCD), an endoplasmic-reticulum-bound enzyme that catalyses the Δ9-cis desaturation of C16:0 and C18:0 SFAs, converting them into C16:1 and C18:1 MUFAs, respectively (Enoch et al., 1976; Ntambi, 1999). The SCD is not only highly expressed in white and brown adipose tissues (Dobrzyn and Dobrzyn, 2006), but also in the skeletal muscle of obese humans and rats (Hulver et al., 2005; Voss et al., 2005). For these reasons, SCD has been well studied as a candidate gene for fatness traits in livestock (Jiang et al., 2008; Maharani et al., 2013).
Several isoforms of SCD are characterized in mice (Ntambi et al., 2004), whereas only single SCD is presented in pigs (Ren et al., 2004b). The porcine SCD was mapped onto the SSC14q27 region and characterized with six exons including relatively long 3′-untranslated region (UTR) compared with 5′-UTR (Ren et al., 2003). This genomic region was previously identified as a quantitative trait loci (QTL) for FA composition and fat melting point in a genome-wide mapping study (Uemoto et al., 2012b), and the SCD included in the region showed highly significant QTL effects on the above-mentioned traits (Uemoto et al., 2012a).
Several previous studies have shown genomic variations in the porcine SCD gene (Ren et al., 2004a, b; Uemoto et al., 2012a; Maharani et al., 2013). The previous studies used the different pig breeds which showed different genomic variations throughout the coding and regulatory regions, respectively. However, to clarify the function of the variations such as the association analysis and gene expression analysis as well has not been performed in the previous studies. Here, we used the Berkshire breed which is well known for high marbling score and good eating quality, based on comparisons of fatness and eating quality among breeds (Suzuki et al., 2003; Wood et al., 2004). The aim of this study was to identify the polymorphisms in the porcine SCD and to reveal its effects on fatness qualities and regulation of the gene expression.
MATERIALS AND METHODS
Animals and fatness traits measurements
A total of a hundred Berkshire pigs (56 females and 44 castrated males) used in this study were raised on the same farm under identical conditions and all were fed the same commercial diet (Tables 1 and 2). The pigs were slaughtered at a similar live weight (110±4 kg) and the longissimus dorsi (LD) muscle samples were taken at 45 min postmortem. The fat was extracted from these samples according to the method by Folch et al. (1957). Gas chromatography was performed and the various FA contents were calculated as described previously (Lee et al., 2010). Meat marbling scores were determined based on National Pork Producers Council (NPPC, 1995) pork quality standards. IMF content was determined using Soxhlet diethyl ether extraction method (AOAC, 2000) and expressed as the weight percentage of wet muscle tissue. BF was expressed as the mean of two values measured at the 11th and last thoracic vertebrae.

Standard pig diet composition

Proximate analysis and fatty acid composition of the standard diet
Identification of polymorphism and genotyping
Genomic DNA was isolated from LD muscle samples using a DNA isolation kit (Intronbio., Seongnam, Korea). Polymerase chain reaction (PCR) and direct sequencing analysis for the promoter and coding region of SCD were performed using specific primers in Berkshire pigs (Table 3). The individual genomic sequence data were assembled for identification of polymorphism as described previously (Kim et al., 2012) and used for genotyping (Figure 1a). To further validate the genotypes, all pigs were re-genotyped using PCR-restriction fragment length polymorphism method by using specific primer set and MspI restriction enzyme (Figure 1b).
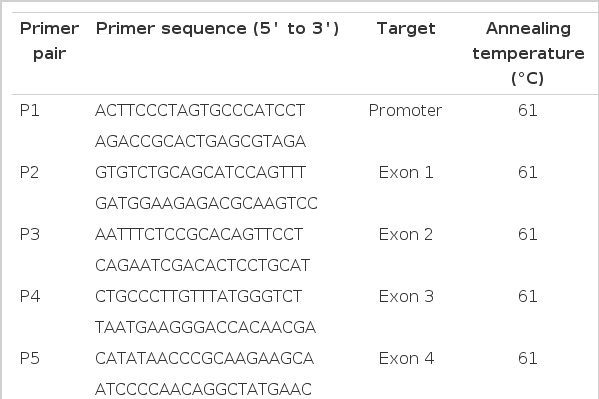
Sequences of primers used for polymerase chain reaction amplification and quantitative polymerase chain reaction
Genotypes of the c.*2041T>C SNP in the 3′ UTR of the SCD gene. (a) Sequence chromatograms showing c.*2041T>C SNP. (b) The electrophoresis image of PCR-RFLP for c.*2041T>C SNP. Digestion of PCR products (425 bp) by MspI, show genotypes TT, TC, and CC. The arrowheads show and the size of DNA ladder and fragments. SNP, single nucleotide polymorphism; UTR, untranslated region; SCD, stearoyl-CoA desaturase; PCR-RFLP, polymerase chain reaction-restriction fragment length polymorphism.
Quantitative real time-polymerase chain reaction analysis
To analyse the SCD mRNA expression levels, twenty-one Berkshire pigs (seven in each genotype group) were randomly selected from the three genotype groups. Total RNA was isolated using TRIzol (Invitrogen, Carlsbad, CA, USA) from the LD muscle samples. The synthesis of first-strand cDNA by using RNA and quantitative PCR was performed as described by Kim et al. (2013) with the specific primers (Table 3). The relative SCD expression levels were analysed according to the 2−ΔΔCT method (Livak and Schmittgen, 2001), by using glyceraldehyde-3-phosphate dehydrogenase (GAPDH) for normalization. The GAPDH expression levels were almost the same among genotypes (Ct values and standard deviations: CC, 15.80±1.08; CT, 15.85±0.78; TT, 16.09±0.77).
Statistical analysis
Chi-square tests were used to test the significance of differences in frequencies of genotype and allele as well as Hardy-Weinberg equilibrium. The association analysis were performed using the general linear model procedure in the SAS statistical software package. The statistical model was as follows: yijkl = μ+Gi+Sj+Pk+eijkl, where yijkl represents the observation, μ is the overall mean, Gi is the fixed effect of genotype i, Sj is the fixed effect of sex j, Pk is the fixed effect of slaughter batch k, and eijkl is the random error. BF was used as a covariate only for FA composition.
RESULTS AND DISCUSSION
In this study, we identified a single nucleotide polymorphism (SNP) c.*2041T>C in 100 Berkshire pigs by sequencing focused on the coding and regulatory regions, including the promoter and 3′-UTRs of the SCD. The c.*2041T>C SNP has been shown to be located in the 3′-UTR on the sixth exon (Ren et al., 2004b; Maharani et al., 2013). In our Berkshire population, however, we could not detect any other polymorphisms that have been reported in the other populations (Ren et al., 2004b; Maharani et al., 2013; Estany et al., 2014).
Genotypic and allelic frequencies were estimated (Table 4) and were consisted with a previous study on the KNP and Landrace F2 population (Maharani et al., 2013). CC and CT genotypes were evenly distributed (0.41 and 0.44), and were more common than the TT genotype (0.15). The C allele (0.63) occurred more frequently than the T allele (0.37). Chi-squared tests revealed that this locus did not deviate from Hardy-Weinberg equilibrium (p = 0.57).
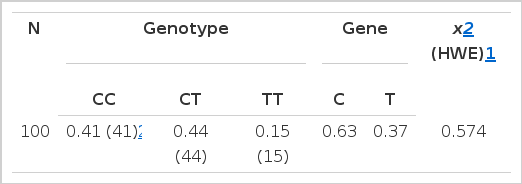
Genotype and gene frequencies of the c.*2041T>C single nucleotide polymorphism in the 3′ untranslated region of the stearoyl-CoA desaturase gene in Berkshire pigs
The results of c.*2041T>C SNP associations with the measured fatness traits are shown in Table 5. Among the MUFAs, pigs with the CC genotype had significantly higher C18:1 content than that in TT pigs (p = 0.039), and the sum of the MUFAs was also higher for CC genotypes than for TT genotypes (p = 0.011). SFAs such as C12:0 and C16:0 were relatively larger in the CC group than in the CT group (p = 0.033 and 0.003, respectively), whereas the sums of the SFAs were not different among genotypes. Moreover, the SNP had significant effects on several polyunsaturated FAs (PUFAs) such as C18:2n-6, C20:4n-6 and C20:5 n-3 (p = 0.012, 0.005, and 0.027, respectively). Consequently, the sum of the PUFAs showed higher levels in TT genotype (p = 0.007). Moreover, the TT genotype showed significantly higher polyunsaturated to saturated (P:S) FA and n-6:n-3 FA ratios (p = 0.018 and 0.048, respectively). The marbling score and IMF differed among the genotypes: the CC genotype had higher scores than that in the TT genotype (p = 0.045 and 0.008, respectively), while BF did not differ.
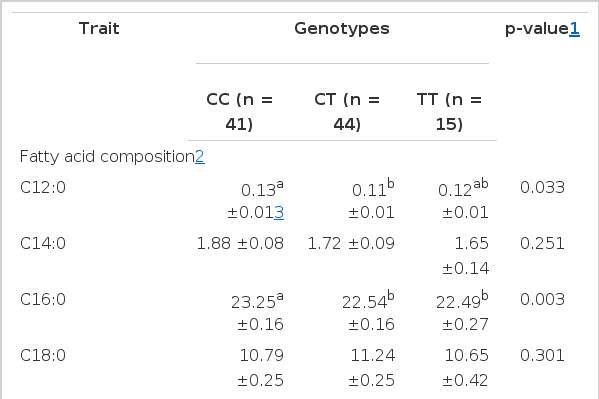
The least squares analysis of different genotypes of c.*2041T>C SNP in the 3′ untranslated region of the stearoyl-CoA desaturase gene with fatness quality traits in Berkshire pigs
We could not compare our results of the c.*2041T>C locus to those of previous studies due to the lack of an association analysis. However, several other SNPs of the 3′-UTR that were detected in different breeds showed significant associations with FA composition and/or other fatness traits (Maharani et al., 2013). Moreover, a previous study reported that the SNP of the 3′-UTR in bovine SCD1 has significant effects on fat deposition and FA composition, but not on BF (Jiang et al., 2008).
To clarify the effects of the c.*2041T>C locus on the SCD transcription level, we performed quantitative PCR to analyse the SCD mRNA expression levels (Figure 2). The c.*2041T>C locus showed a significant effect on SCD mRNA expression levels (p = 0.041). The CC genotype had a higher expression level than that in the CT and TT genotypes. The SCD mRNA expression level can be suppressed by dietary PUFAs (Ntambi, 1999). However, the CC group showed relatively high SCD expression levels and high oleic acid (C18:1) and MUFA contents, although the pigs in this study were fed a relatively high dietary PUFA, α-linoleic acid (C18: n-6) content. In addition, the high SCD mRNA expression levels of the CC group could be strongly related to high IMF levels with no increase of BF, based on a previous study (Miyazaki et al., 2001).
Relative mRNA levels of porcine SCD in the longissimus dorsi muscle of Berkshire pigs according to genotypes of c.*2041T>C SNP. The SCD mRNA levels were normalised to those of GAPDH. All values are expressed as mean ±standard error of three independent experiments. A and B indicate significantly different groups, as determined by ANOVA (p = 0.041). SCD, stearoyl-CoA desaturase; SNP, single nucleotide polymorphism; GAPDH, glyceraldehyde-3-phosphate dehydrogenase; ANOVA, analysis of variance.
The genetic structure of the 3′-UTR could affect to post-transcriptional regulatory mechanisms (Shabalina and Spiridonov, 2004). Porcine SCD contains a relatively long 3′-UTR (3,878 bp) compared with a coding region (1,080 bp) and 5′-UTR (176 bp), but it also contains AU-rich elements, 15-lipoxygenase differentiation control element (15-LOX-DICE), and CPE elements, all of which play crucial roles in mRNA degradation and translational regulation (Ren et al., 2004b). Moreover, the SCD gene and FA metabolism related gene expressions could be regulated by specific miRNA-378 based on 3′-UTR during lipogenesis (Gerin et al., 2010). Taken together, we could inferred that the SNP in the 3′-UTR of SCD can mediate the regulation of SCD mRNA expression and consequently affect FA metabolism and pork fatness traits.
Our study focused on the validation of polymorphism in the porcine SCD which is responsible for the gene regulation and fatness traits. We identified the c.*2041T>C SNP in the 3′-UTR throughout the coding and regulatory genomic regions in Berkshire pigs. The SNP had significant effects on the expression levels of SCD mRNA and strong associations with fatness quality traits including FA contents and IMF. Considering our results, we suggest that the SCD SNP c.*2041T>C in Berkshire pigs plays a role in gene regulation and affects fatness qualities.
ACKNOWLEDGMENTS
This study was supported by a grant from the Next-Generation BioGreen 21 Program (No. PJ008089), Rural Development Administration, Republic of Korea.