


INTRODUCTION
Chicken coccidiosis is a debilitating disease that has imposed a substantial economic burden on the global chicken breeding industry due to declines in productivity, elevated mortality rates, and costs associated with disease prevention [1]. This parasitic disease is caused by protozoa belonging to genus Eimeria, which colonize the duodenum, jejunum, ileum, and cecum of chickens, eliciting an inflammatory reaction [1]. Upon Eimeria infection, affected chickens exhibit diarrhea, compromised nutrient absorption and growth, and the induction of cellular and humoral immune responses [2]. Enhanced cellular and humoral immune functions play a pivotal role in bolstering resistance against Eimeria infection, consequently mitigating intestinal damage and curtailing oocyte development [3,4]. The involvement of T lymphocytes is crucial during coccidiosis infection, as they orchestrate cellular immunity [4]. Therefore, it is essential to improve the immune capacity of chickens to increase resistance to Eimeria infection.
The MHC is an important molecular system that profoundly influences the chicken immune response. MHC molecules on cell membranes facilitate crucial cell-to-cell communication within the immune system [5]. Notably, when cells are infected by pathogens, antigen-presenting cells process and present protein fragments derived from these pathogens, and T cells and natural killer cells identify them, thereby triggering immune responses. During parasite infestation, MHC molecules play a critical role by presenting parasite-derived antigens to T cells, thereby contributing significantly to the adaptive immune system [6]. In addition, MHC class I and II affect intestinal parasite resistance via the microbiome [7]. The resistance of chickens to Eimeria infection is related to MHC genetics, with resistance and susceptibility differing depending on the MHC gene haplotype. However, the precise involvement of individual genes within the chicken MHC gene region in the response to Eimeria infection remains to be fully elucidated [8].
Many genes on chicken chromosome 16 play significant roles in the immune response [8]. This chromosome harbors an MHC-B gene region responsible for classical antigen presentation and an MHC-Y gene region that includes specialized class I and II genes plus C-type lectin-like genes [8]. Although many functional studies have elucidated the roles of MHC-B genes in disease resistance, the precise association between mutations in MHC-Y genes and disease resistance remains elusive [9,10].
To uncover candidate genes and biological pathways underlying the immune response to disease, researchers have investigated changes in gene expression [11–13]. RNA sequencing technology has enabled comprehensive examinations of gene expression across the genome. By identifying the immune responses of livestock to specific diseases, these studies offer valuable insights into the proteins involved in immune function, the corresponding genes that encode them, and the factors that regulate gene expression. Consequently, gene expression data assumes paramount importance in studies focused on understanding the immune response.
Numerous studies have examined chicken coccidiosis to develop antibiotic alternatives [14,15] and effective anti-coccidial vaccines [16,17], and identified candidate genes associated with immune function [11,18]. Previously, our research team identified chronological changes in gene expression patterns throughout the genome in the cecum of broilers affected by coccidiosis, thereby elucidating key responses and pathways [11]. Building upon these past findings, the present study aims to extend our understanding by investigating the gene expression profiles of chromosome 16, encompassing MHC genes, using an updated reference genome.
MATERIALS AND METHODS
Animal care
The animal study was reviewed and approved by the Animal Ethics Committee of Chungnam National University (202012A -CNU-164).
Eimeria infection and sample collection
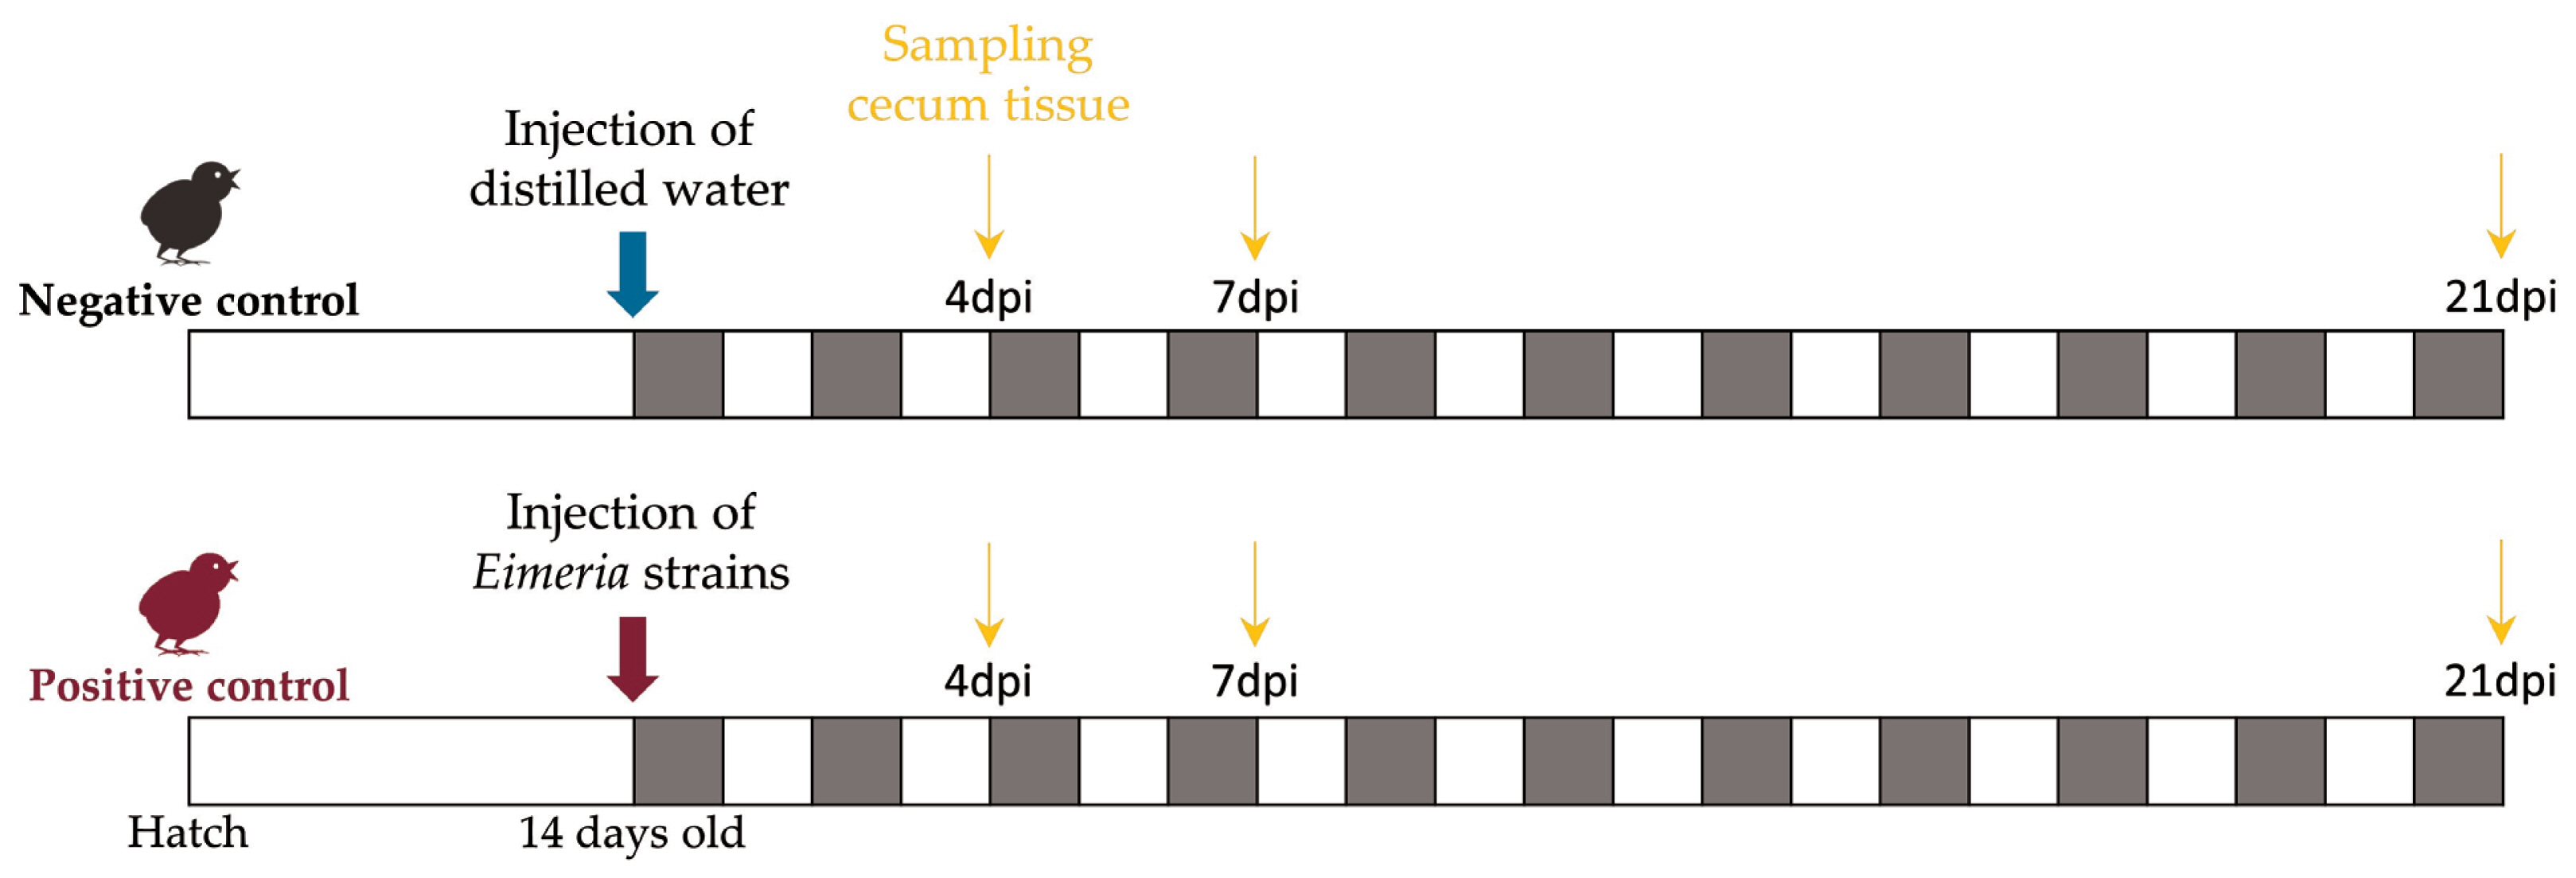
Figure 1 summarizes the experimental design. This study used 39 1-day-old male broiler chicks (Indian River; Aviagen, AL, USA). After ensuring that the chicks were free from oocysts, we randomly allocated them to 13 cages. Following a 14-day acclimation period, 21 chickens, referred to as the positive control (PC), were orally administered 1 mL of Livacox T (Biopharm, Prague, Czech Republic), which is a live attenuated vaccine. Each chicken in the PC group received a 10-fold increased dose containing 3 to 5×10³ active oocysts of Eimeria acervulina, Eimeria tenella, and Eimeria maxima for infection. The 18 chickens in the non-challenged negative control (NC) were inoculated with distilled water to simulate inoculation stress.
At 4, 7, and 21 days post-infection (dpi), birds in the PC and NC treatments were humanely euthanized. Cecum tissue samples were collected from all chickens and used for RNA extraction. At each time point, three samples from the NC group and five samples from the PC group were randomly selected for RNA sequencing.
RNA extraction and sequencing
Total RNA was extracted from cecal tissue samples using TRIzol reagent (Invitrogen, Carlsbad, CA, USA). The TruSeq Stranded mRNA sample preparation kit (Illumina, San Diego, CA, USA) was used to construct a cDNA library. Following library construction, all samples were sequenced on the Illumina NovaSeq 6000 platform, which generated 101 bp paired-end reads.
Sequencing read processing and differentially expressed gene analysis
Adaptor-trimmed sequence data, which we described previously [11], were mapped to the chicken reference genome (GRCg7b, GCA_016699485.1). The reference genome was constructed using bowtie2 v2.5.1 and SAMtools v1.17. STAR v2.7.10b was used for sequence mapping to the reference genome and counting mapped reads. The gene annotation version used was GRCg7b (National Center for Biotechnology Information Annotation Release 106). The EdgeR v3.42.4 package in R [19] was used to quantify gene expression. To avoid statistical bias, only genes with a total read count >8 were used for estimating expression levels. Then, the read count was normalized using the trimmed mean of M-value method. Expression levels were compared between the PC and NC groups at every time point. The p-values of the differential expression tests were adjusted using the false discovery rate (FDR) method [20]. Then, genes located on chicken chromosome 16 were selected for the next step. Significant DEGs were defined based on the following criteria: FDR<0.05 and absolute fold change ≥1.5. A lower level of significance for differential expression was also identified within the range 0.05≤FDR<0.1 and absolute fold change ≥1.5. The final DEGs were identified at each time point. Volcano plots depicting the DEGs were generated using the ggplot2 package in R [21]. To determine the functions of the group of DEGs, gene ontology (GO) and Kyoto encyclopedia of genes and genomes (KEGG) analyses were performed using the Database for Annotation, Visualization, and Integrated Discovery (DAVID). Gene functions were also searched in the relevant literature.
RESULTS
Results of RNA sequencing and read mapping
Sequencing of the 24 samples yielded an average of 40,967,230 raw reads per sample after combining forward and reverse sequences. After removing sequencing adapters and trimming low-quality reads, at least 98.29% of the reads remained in all datasets. On average, 40,455,803 reads were retained for subsequent mapping. We aligned the reads to the chicken reference genome, and successfully assembled an average of 37,600,629 reads (approximately 92.95% of the total mapped reads). Table 1 summarizes the sequence data processing.
Differentially expressed genes between the NC and PC groups
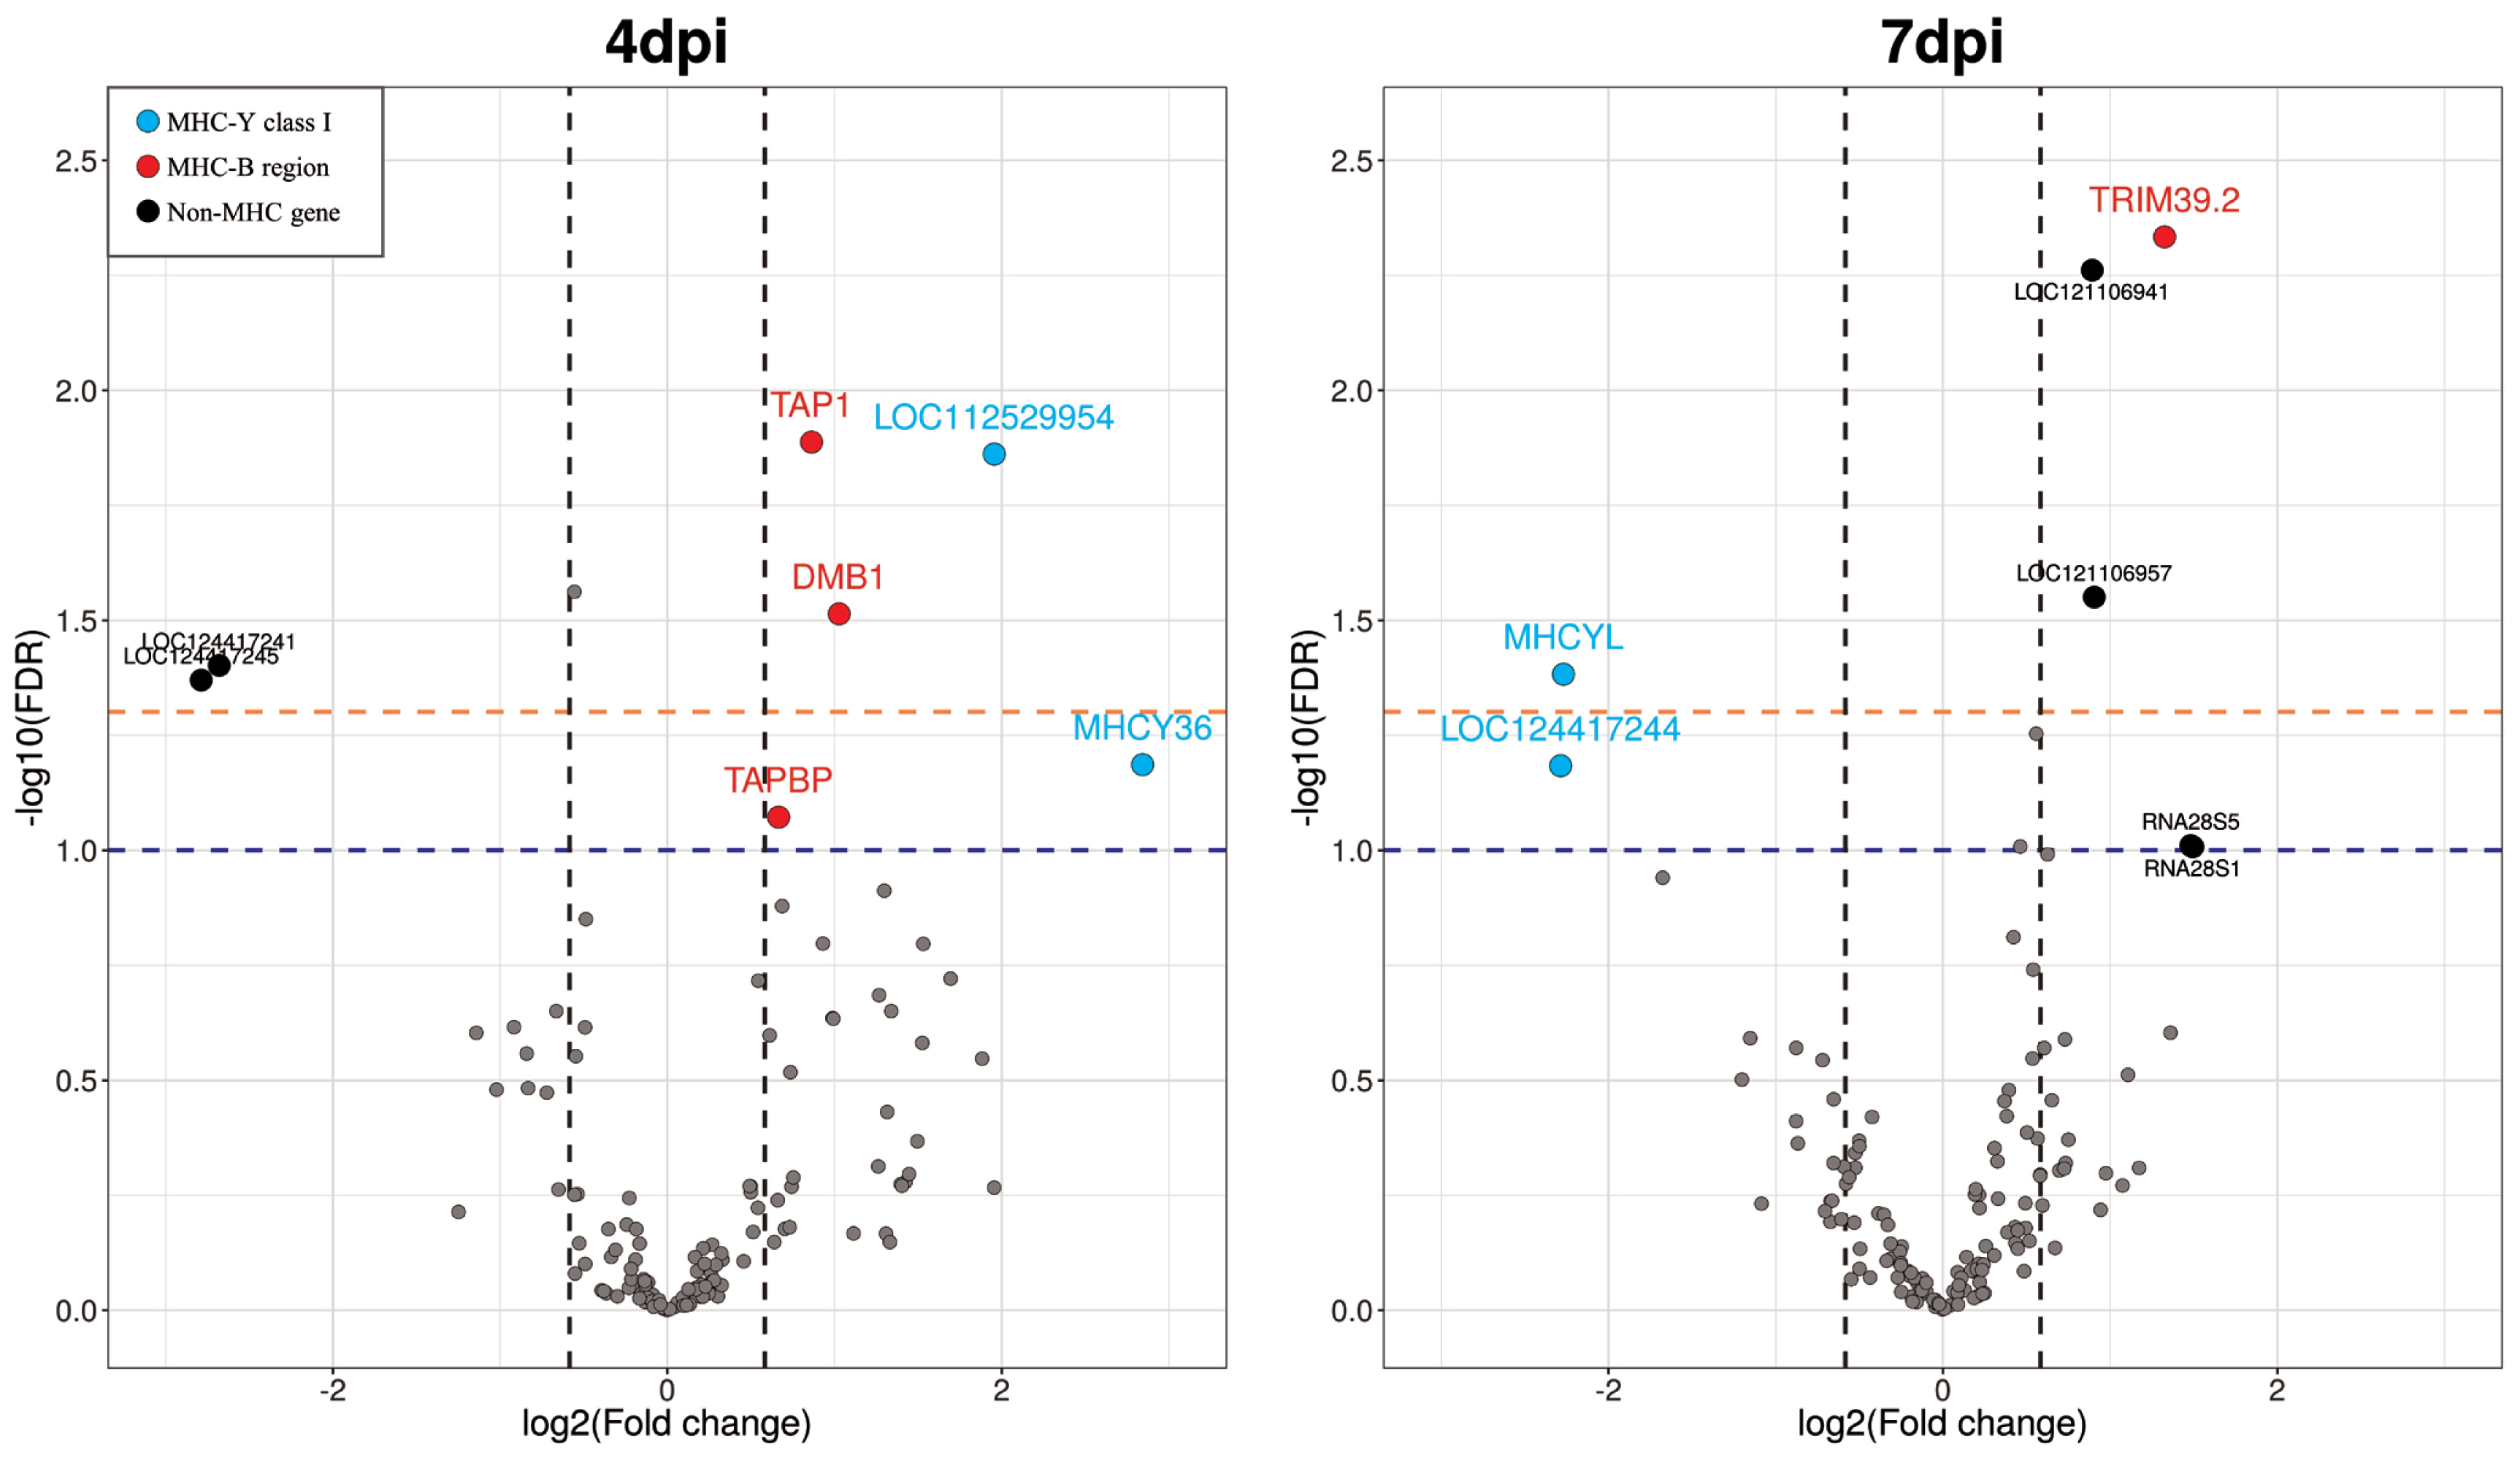
The chicken chromosome 16 reference genome contained 309 annotated genes. Figure 2 and Table 2 present the findings for 4 dpi, in which five significant DEGs were identified as having FDR<0.05. Of these DEGs, three genes were upregulated in Eimeria-infected chickens, whereas two genes were downregulated. Two additional upregulated genes were identified among DEGs with a lower significance threshold (0.05≤FDR<0.1). Upon comparing the NC and PC samples at 7 dpi, we found four significant DEGs having FDR<0.05. Of these genes, three genes were upregulated and only one gene was downregulated in Eimeria-infected chickens. Also, there were two additional upregulated genes and one downregulated gene showing a lower significance level (0.05≤FDR <0.1). Notably, no differential expression was observed in any gene at 21 dpi. Therefore, the gene expression comparison results for 21 dpi were excluded from subsequent analyses.
Categorization of differentially expressed genes based on gene clusters
In Eimeria-infected chickens, five genes had significantly higher expression at 4 dpi (FDR<0.1). These genes included MHCY36 and LOC112529954, which are located in the MHC-Y region of the chicken genome, and DMB1, TAP1, and TAPBP, which are located in the MHC-B region. Of the downregulated genes, two (LOC124417245 and LOC124417241) were in the non-MHC region. Notably, at 4 dpi, the most significant DEG was the TAP1 gene and the largest fold change was for the MHCY36 gene.
At 7 dpi, five genes were significantly upregulated (FDR<0.1): the TRIM39.2 gene in the MHC-B region and LOC121106941, LOC121106957, and two ribosomal RNA genes in the non-MHC region. Two genes (MHCYL and LOC124417244) downregulated in infected chickens were classified in the MHC-Y class I gene cluster. Among the upregulated genes, the TRIM39.2 gene had the most significantly upregulated differential expression (FDR = 0.0046). The differential gene expression results are provided in Table 2 and Figure 2.
Functional analysis of differentially expressed genes
GO analysis conducted on the DEGs at 4 and 7 dpi yielded no significant GO terms. However, KEGG analysis revealed one significant biological pathway (p = 0.03) at 4 dpi, herpes simplex virus 1 infection (gga05168) pathway, which includes the TAP1 and TAPBP genes.
DISCUSSION
In this study, we examined the roles of chicken MHC genes, which have not been fully characterized functionally. Differential expression of chicken MHC genes was observed in cecal tissues infected with Eimeria. This is the first study to focus on MHC gene expression in coccidiosis-infected chickens.
The number of DEGs on chicken chromosome 16 was higher at 4 dpi than at 7 dpi in Eimeria infection. This trend of decreasing numbers of DEGs differed from that of a previous study, which observed numerous DEGs across the whole genome as a result of heightened cellular stress and subsequent recovery [11]. These mechanisms were triggered by parasitic attack, rather than being associated with the effects of MHC-related genes. Considering studies that reported a decrease in symptoms after 7 days of coccidial infection [22, 23], we inferred that the immune response of MHC-related genes changed between 4 and 7 dpi. This finding suggests a dynamic immune response during the course of Eimeria infection, particularly in relation to MHC genes.
Notably, the pattern of DEGs changed over time following infection. Specifically, the TAP1 and TAPBP genes showed a significant increase in expression at 4 dpi, but not at 7 dpi. TAP1, in conjunction with TAP2, forms the transporter associated with antigen processing (TAP) complex, which plays a crucial role in processing antigenic peptides for loading onto MHC class I molecules. Additionally, tapasin, which is encoded by the TAPBP gene, assists in the interaction between the TAP complex and MHC class I molecules [24]. The action of TAP is essential for processing antigens derived from intracellular protozoan parasites [25]. Therefore, we inferred that antigen presentation via MHC class I molecules was strongly induced at 4 dpi. According to KEGG pathway analyses of DEGs at 4 dpi, TAP and tapasin process antigenic peptides derived from viral proteins and deliver them to MHC class I when a chicken is infected by a pathogen. Our experiment further demonstrated the operation of this pathway.
In comparison, DMB1 gene expression increased only at 4 dpi. The DMB1 gene is a non-classical MHC-II gene that plays a role in the transmission of exogenous antigens in the chicken [26]. Parker et al [27,28] reported that the only chicken tissues in which DMB1 was highly expressed were the intestine and spleen, confirming that DMB1 is involved in immunity in the infected cecum. As a result, the upregulation of TAP-related genes and the DMB1 gene at 4 dpi demonstrated the role of both MHC class I and II in Eimeria infestation.
Additionally, MHCY36 and LOC112529954 were upregulated DEGs at 4 dpi; these genes are functionally related to MHC-Y class I molecules. MHC-Y class I molecules lack the ability to present antigens [8]. However, because MHC-Y genes were significantly upregulated in the cecum at 4 dpi, we infer that MHC-Y class I is responsible for a specific immune response. This finding supports a previous report that MHC-Y genes may be involved in disease resistance [10]. The current result is in line with studies showing the upregulation of chicken MHC-Y genes in response to bacteria and sheep red blood cells [29–31].
Interestingly, the expression pattern of these MHC-Y class I-related genes was reversed at 7 dpi. MHC-Y class I genes were significantly upregulated at 4 dpi, whereas DEGs related to MHC-Y class I genes were downregulated at 7 dpi. According [32], Eimeria infection reduces the expression of antimicrobial peptides, and pathogens such as the Marek disease virus induce the downregulation of MHC genes [33], which blocks the host immune response and increases susceptibility to invasion. Thus, Eimeria may have suppressed the MHC-Y immune response at 7 dpi.
The TRIM39.2 gene, which is in the MHC-B region, was differentially expressed at 7 dpi with the highest level of significance (FDR = 0.0046). Although no structural variants or functions of TRIM genes have been identified in chickens, based on homology with other species, TRIM genes seem to confer innate immunity from viral infection [8,34,35]. There is no evidence that TRIM39.2 acts in conjunction with MHC-B genes in chickens, and no DEG was found to be functionally related to the classical MHC-B molecule at 7 dpi. As of now, there is no evidence that the TRIM genes are functional in intracellular infections in chickens, although they were significantly upregulated in this experiment.
The limited results obtained from the functional analyses using GO and KEGG in this study can be attributed to two factors. First, statistical performance was restricted by the small number of DEGs analyzed. Second, little is known about chicken MHC genes. The number of loci in the MHC-Y gene region was determined only recently [36]; however, the gene functions remain to be studied in many cases. Consequently, we did not anticipate extensive results from the gene function database analysis, as the functions of many recently discovered genes are not known. Future studies should explore the functions of chicken MHC genes, to enable more comprehensive functional analyses.
Importantly, this study elucidated the role of chicken MHC genes under disease conditions. Of particular note is the identification of the association between both MHC-B and MHC-Y genes and the response to pathogen-induced diseases. Although our understanding the precise involvement of the MHC gene in the disease response remains incomplete, further functional genetics research should shed light on this relationship.
CONCLUSION
We examined the immune response of broiler chickens to Eimeria infection at different time points using RNA sequencing and observed the expression patterns of several DEGs on chicken chromosome 16. The results confirmed that MHC classes I and II play roles in immunity during Eimeria infection, and that MHC-Y and MHC-B genes were involved in the immune responses. Both gene families changed their differential expression patterns over time. The MHC genes potentially affecting disease resistance reported in this study will be useful for breeding resistant chickens and developing effective drugs and/or vaccines to overcome coccidiosis in the chicken industry.
 PDF Links
 PubReader
 ePub Link
 Full text via DOI
 Download Citation
 Print
Print


