Go to Top Go to Bottom
Anim Biosci > Volume 35(4); 2022 > Article
Zhao, Jin, Xu, and Jia: Genetic variants of the growth differentiation factor 8 affect body conformation traits in Chinese Dabieshan cattle

Abstract

Objective

The growth differentiation factor 8 (GDF8) gene plays a key role in bone formation, resorption, and skeletal muscle development in mammals. Here, we studied the genetic variants of GDF8 and their contribution to body conformation traits in Chinese Dabieshan cattle.

Methods

Single nucleotide polymorphisms (SNPs) were identified in the bovine GDF8 gene by DNA sequencing. Phylogenetic analysis, motif analysis, and genetic diversity analysis were conducted using bioinformatics software. Association analysis between five SNPs, haplotype combinations, and body conformation traits was conducted in 380 individuals.

Results

The GDF8 was highly conserved in seven species, and the GDF8 sequence of cattle was most similar to the sequences of sheep and goat based on the phylogenetic analysis. The motif analysis showed that there were 12 significant motifs in GDF8. Genetic diversity analysis indicated that the polymorphism information content of the five studied SNPs was within 0.25 to 0.5. Haplotype analysis revealed a total of 12 different haplotypes and those with a frequency of <0.05 were excluded. Linkage disequilibrium analysis showed a strong linkage (r2>0.330) between the following SNPs: g.5070C>A, g.5076T>C, and g.5148A>C. Association analysis indicated these five SNPs were associated with some of the body conformation traits (p<0.05), and the animals with haplotype combination H1H1 (-GGGG CCTTAA-) had greater wither height, hip height, heart girth, abdominal girth, and pin bone width than the other (p<0.05) Dabieshan cattle.

Conclusion

Overall, our results indicate that the genetic variants of GDF8 affected the body conformation traits of Chinese Dabieshan cattle, and the GDF8 gene could make a strong candidate gene in Dabieshan cattle breeding programs.

INTRODUCTION

Dabieshan cattle are a local breed, mainly raised in the central plains of China [1]. They are usually tawny, but individuals can also have black coloration. Dabieshan cattle are one of the most important local breeds in China because of the quality of their meat and adaptability. Given their longer generation times, high costs, and the increased labor they require, the growth of Dabieshan cattle by traditional breeding is slow. Body conformation traits, such as body length (BL), wither height (WH), hip height (HH), and heart girth (HG) are markedly lower in Dabieshan cattle compared with other exotic commercial cattle breeds and urgently need to be improved.
The growth and differentiation factor 8 (GDF8) gene, also known as myostatin, was first cloned in the mouse muscle cDNA library in 1997 [2]. Thomas et al [3] indicated that GDF8 plays an important role in muscle differentiation and growth by inhibiting the formation and differentiation of muscle cells and impeding the growth of skeletal muscles. In Belgian Blue and Piedmontese cattle breeds, natural mutations, or deletions in GDF8 gene have been shown to promote the proliferation and hypertrophy of muscle cells and fibers, which resulted in a 20% enhanced muscle mass [4]. In Shaanbei White Cashmere goats, a 5-bp indel in GDF8 was shown to affect body conformation traits, such as body height, HH, and chest width index [5]. Yang [6] showed that single nucleotide polymorphisms (SNPs) in GDF8 affected the body height, BL, HG, and hucklebone width in Nanyang, Qinchuan, and Jiaxian red cattle. These findings suggest that GDF8 could make an excellent candidate gene for body conformation traits in livestock.
The objectives of this study were to investigate the SNPs within GDF8, and their associations with body conformation traits in Chinese Dabieshan cattle. The result of this study could be used to improve the design of breeding plans.

MATERIALS AND METHODS

All procedures involving animals in this study were approved by the Animal Care and Use Committee of the Anhui Academy of Agricultural Sciences (approval number A19-CS08).

Sequence alignment, phylogenetic analysis, and motif analysis

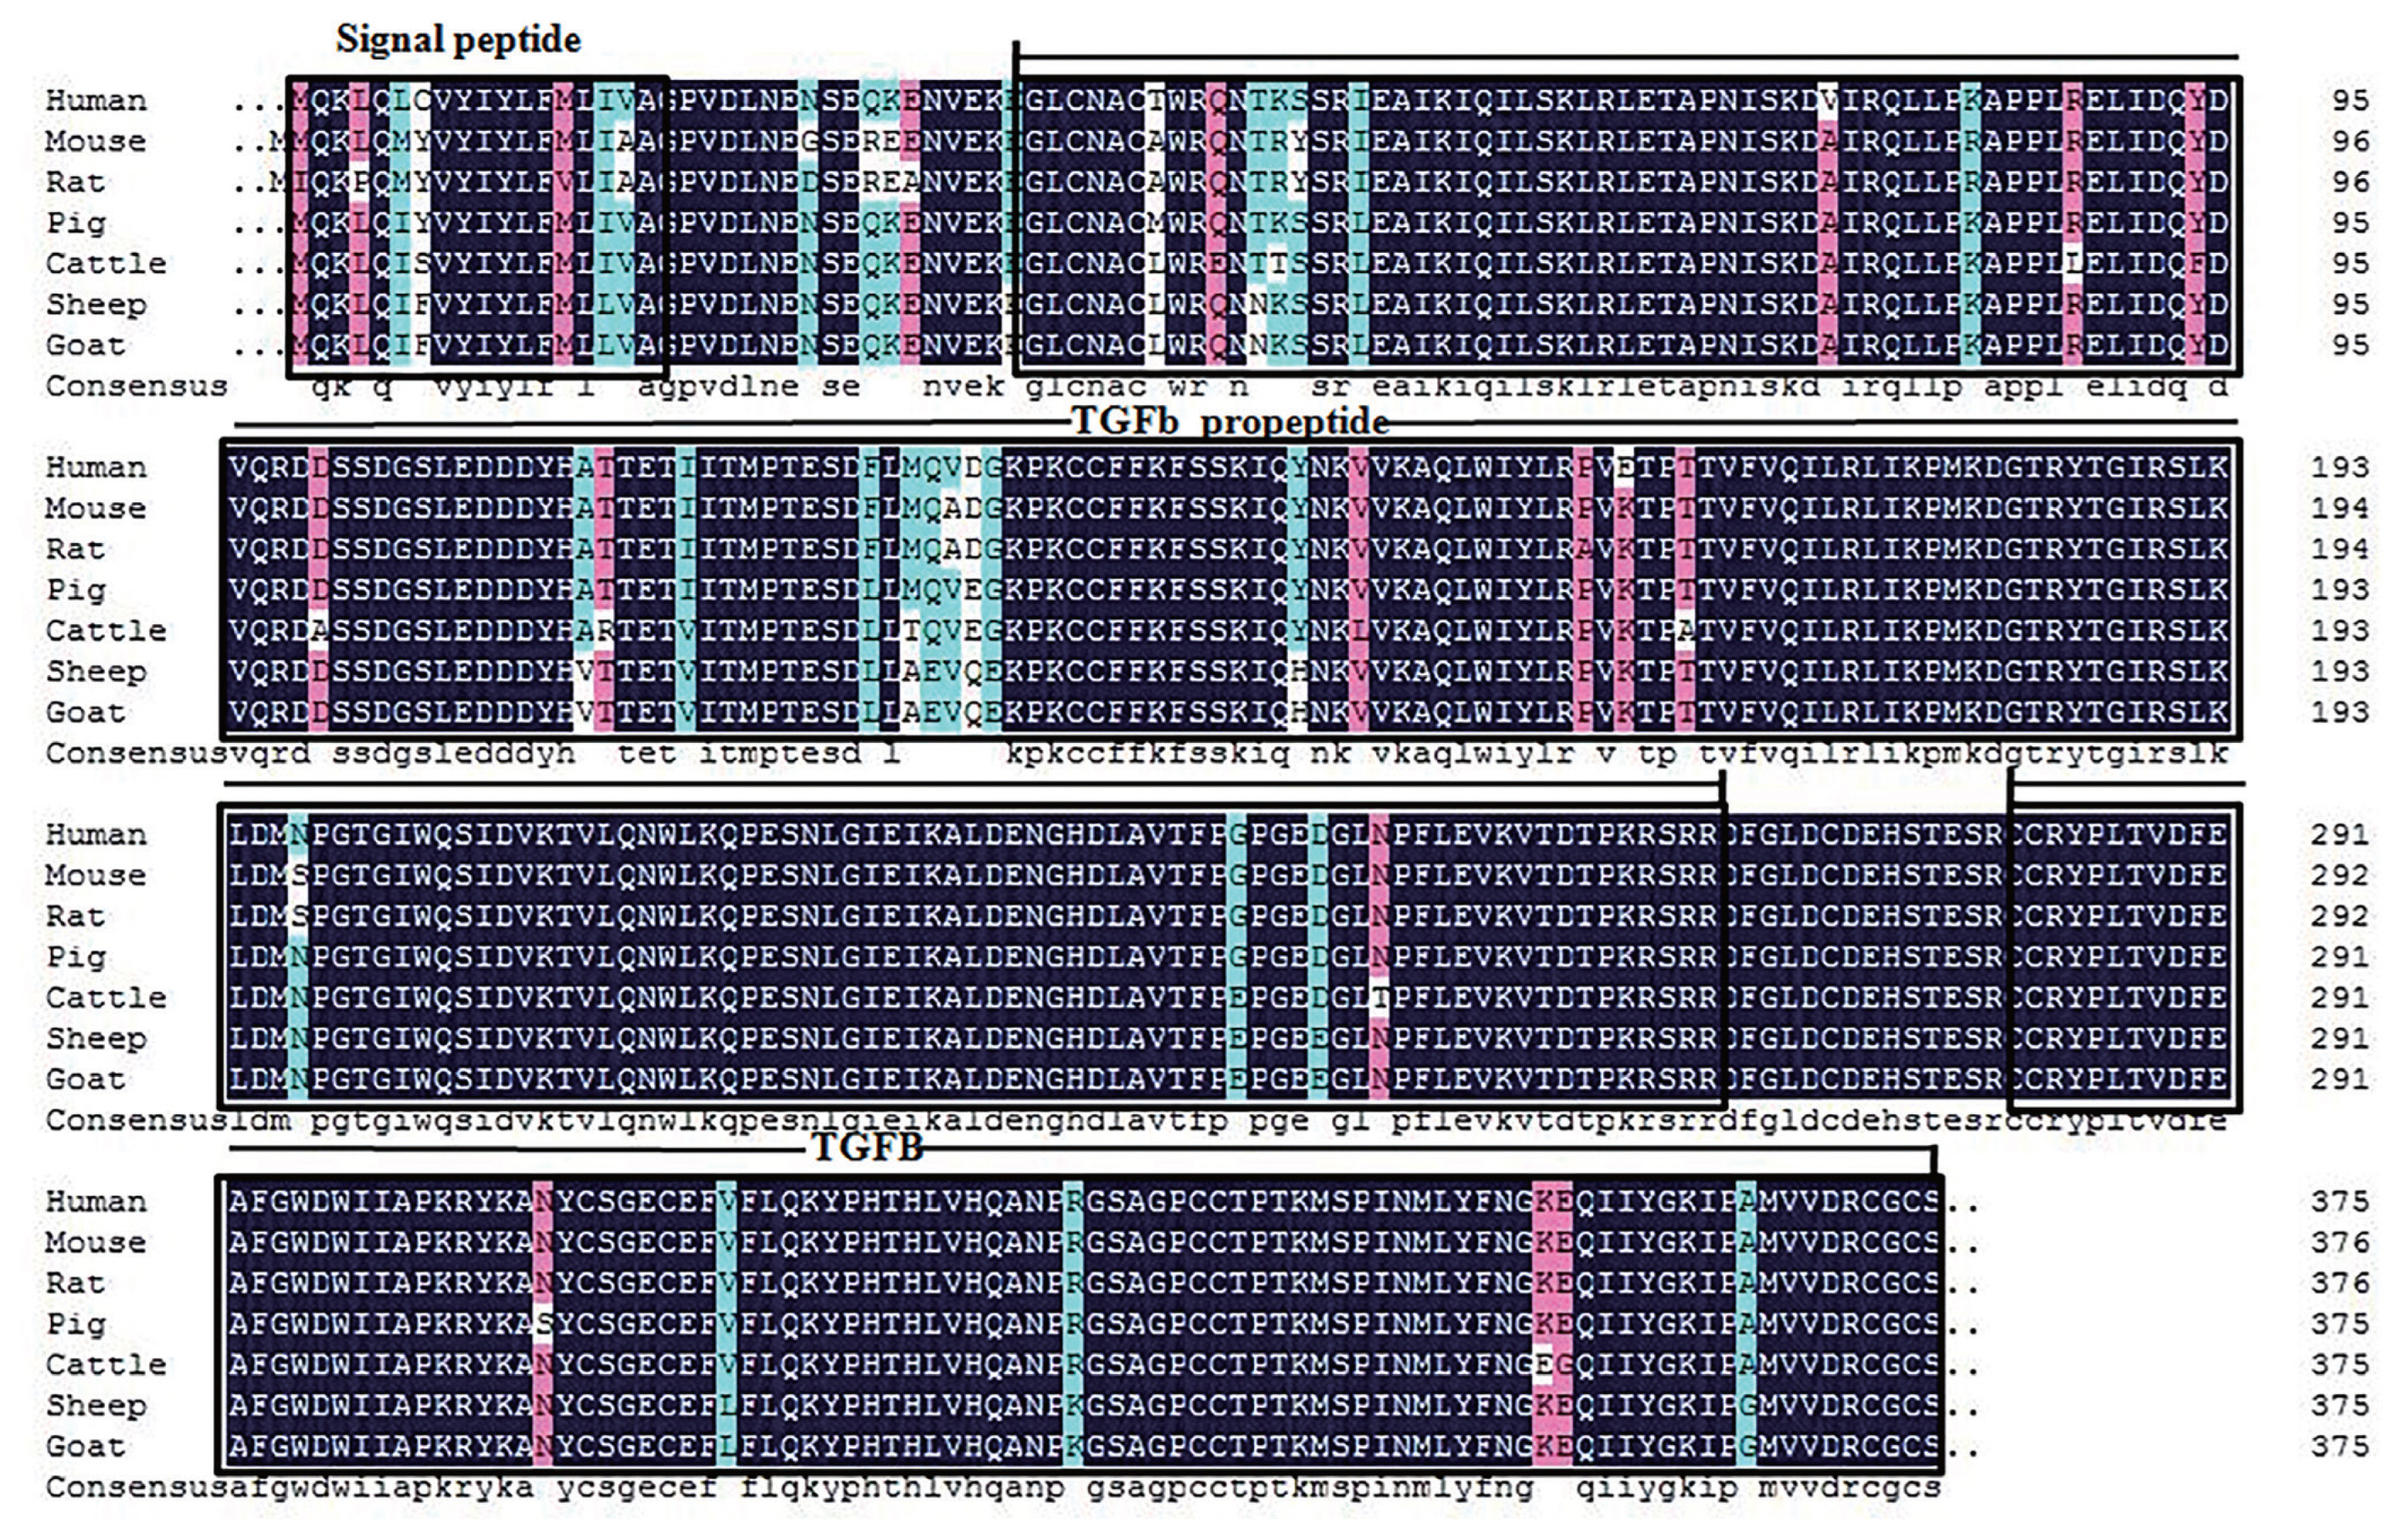
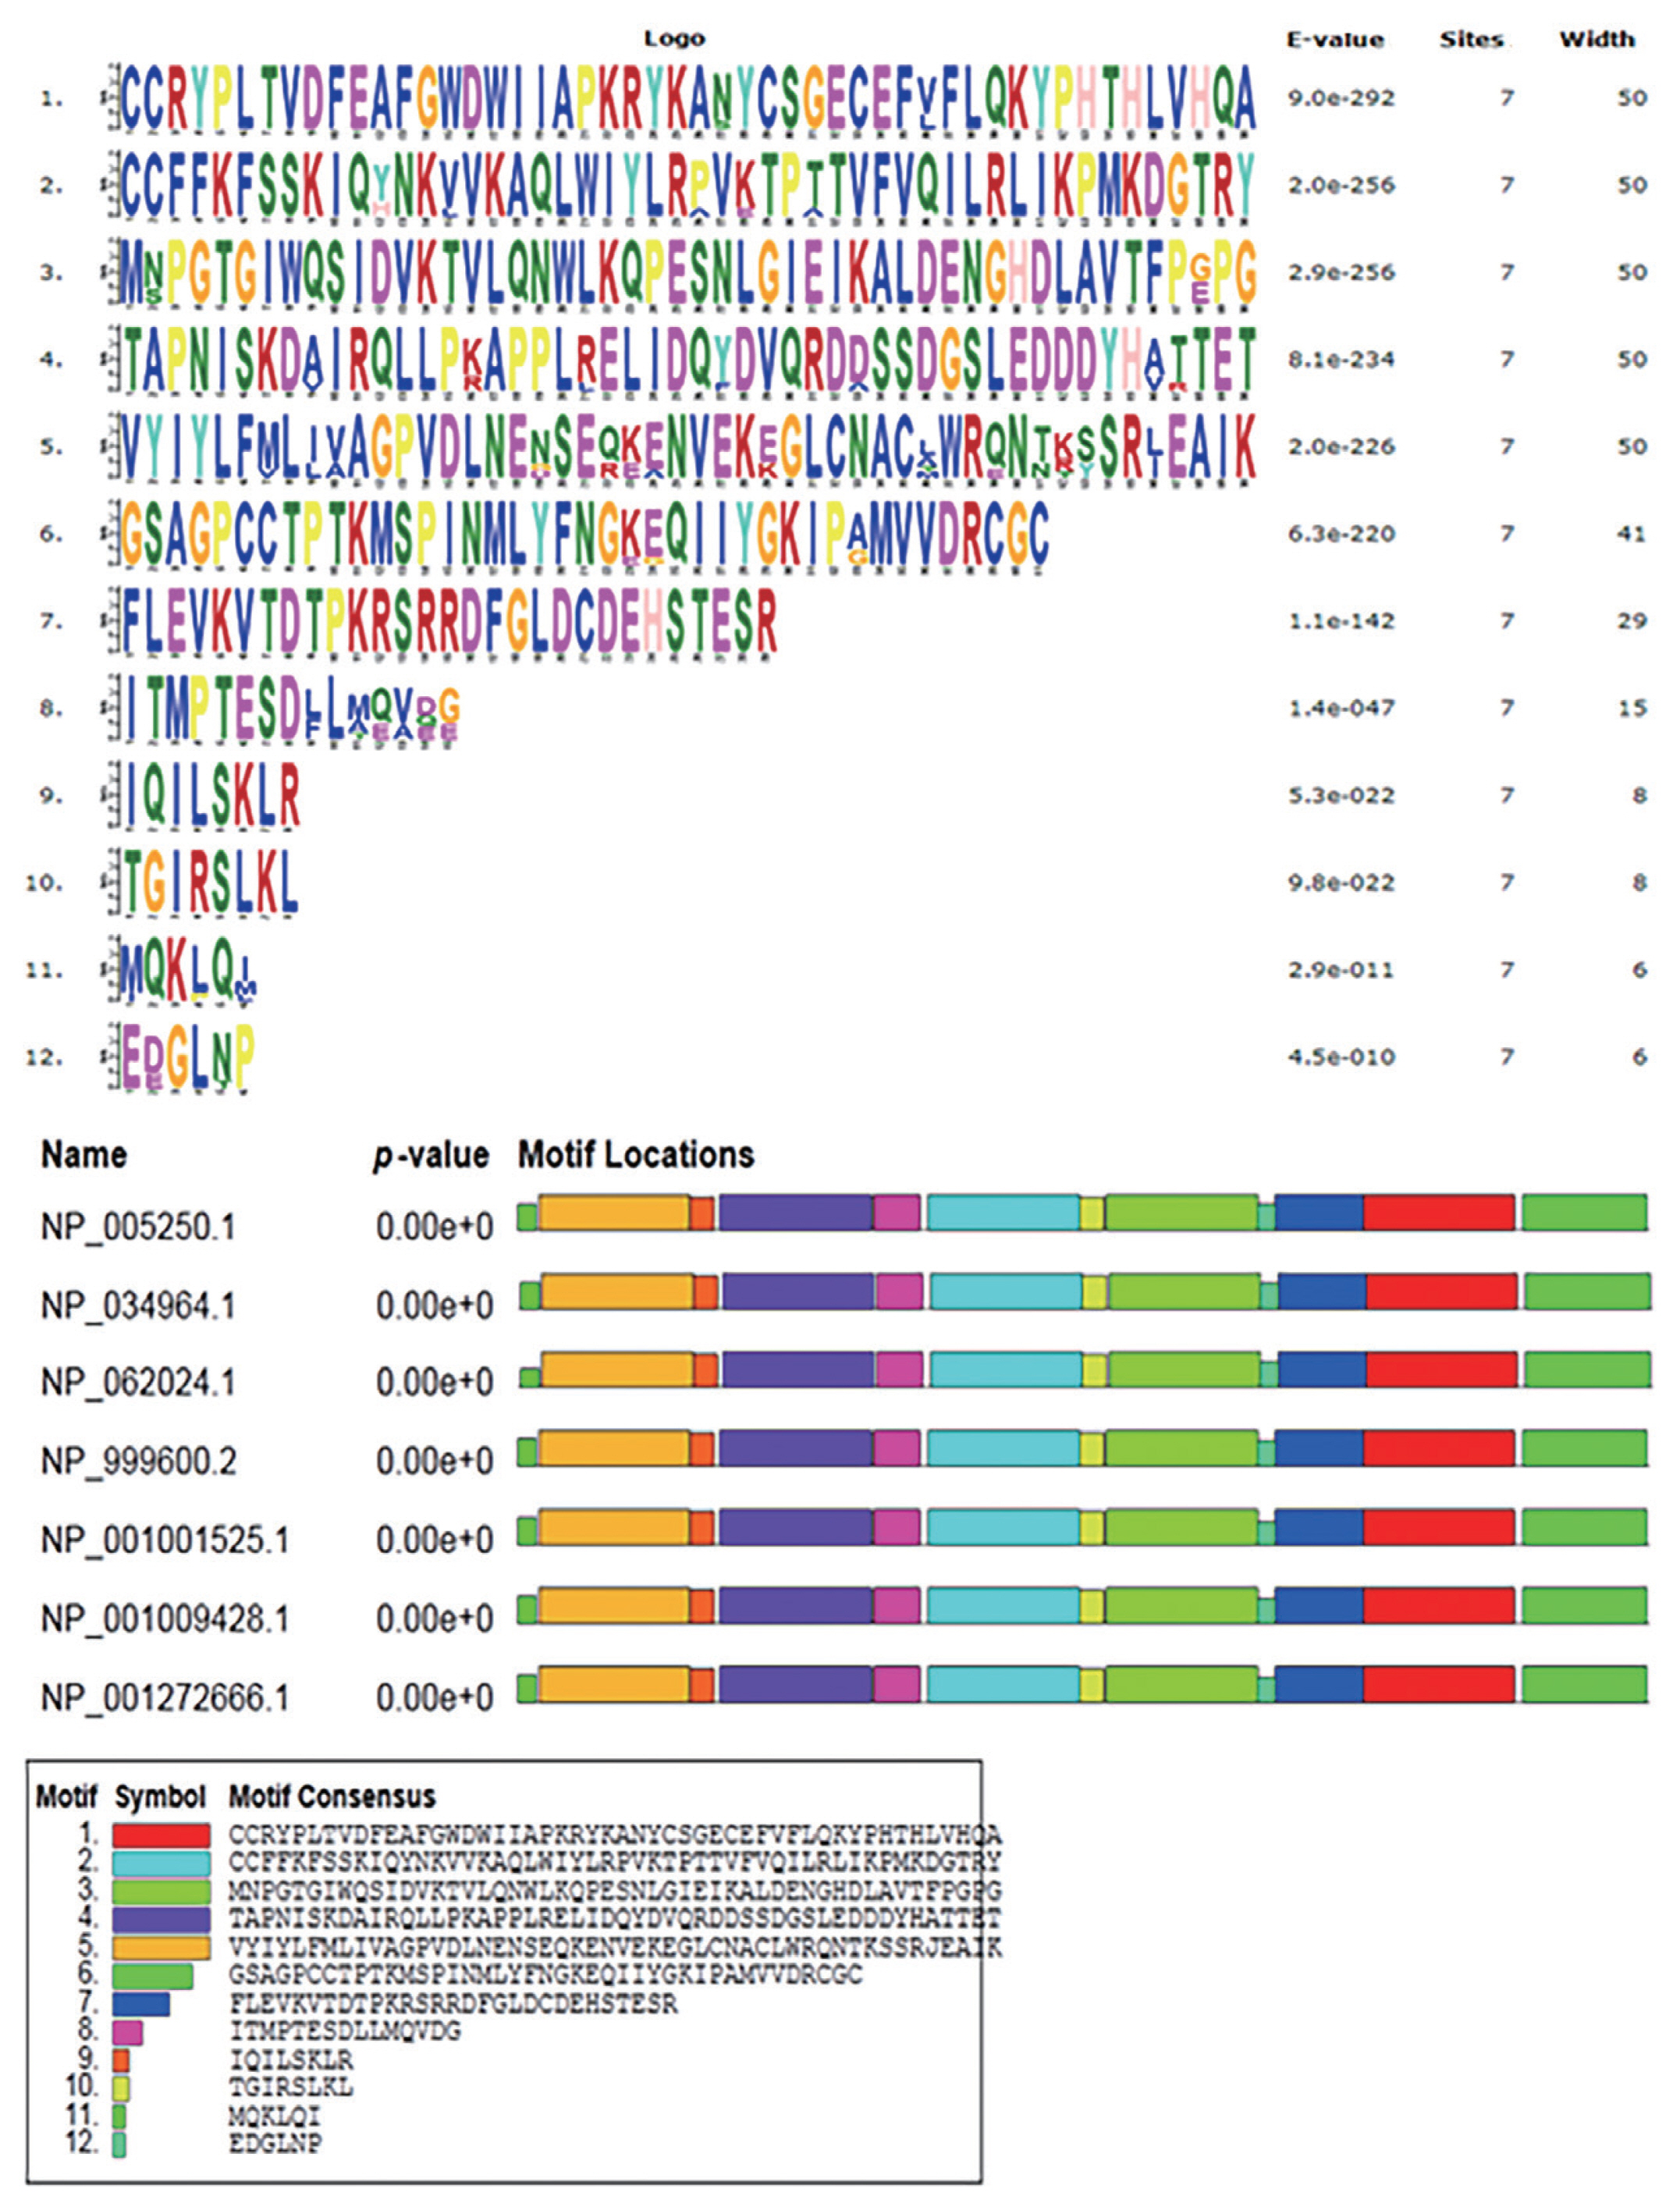
Amino acid sequences of GDF8 in seven species, including cattle (Bos taurus NP_001001525.1), human (Homo sapiens NP_005250.1), rat (Rattus norvegicus NP_062024.1), goat (Capra hircus NP_001272666.1), mouse (Mus musculus NP_034964.1), sheep (Ovis aries NP_001009428.1), and pig (Sus scrofa NP_999600.2), were downloaded from the NCBI database. Multiple sequencing alignment was performed, and a phylogenetic tree was built for GDF8 sequences using the neighbor-joining method in MEGA (version 7.0.26) [7]. Protein structure-function, motifs, and conserved domains were analyzed using MEME Suite [8] and NCBI Conserved Domain Database [9].

Animals, genotypes, and phenotypes

The body conformation traits of 380 Chinese Dabieshan cattle managed in the Species Resources Protection Farm in Anhui, China, were studied. The animals were not pregnant, and all individuals were separated by more than three generations. Cattle were fed a diet based on the Nutrient Requirements of beef cattle (8th, NRC, 2016), which included 25% concentrate and 75% roughage (corn silage and dry straw) on a total mixed ration basis, along with abundant water.
Ear marginal tissues were collected from these animals. Genomic DNA was extracted using the TIANamp Genomic DNA Kit (TIANGEN, Beijing, China) and measured by a spectrophotometer. Genomic DNA was then diluted to 50 ng/μL for polymerase chain reaction (PCR) analysis. We also collected phenotypic data following the methods of Wang et al [10] and Yang et al [11]. Traits measured in this study were BL, WH, HH, HG, abdominal girth (AGR), hip width (HW), and pin bone width (PBW).

Primers, polymerase chain reaction, and gel electrophoresis

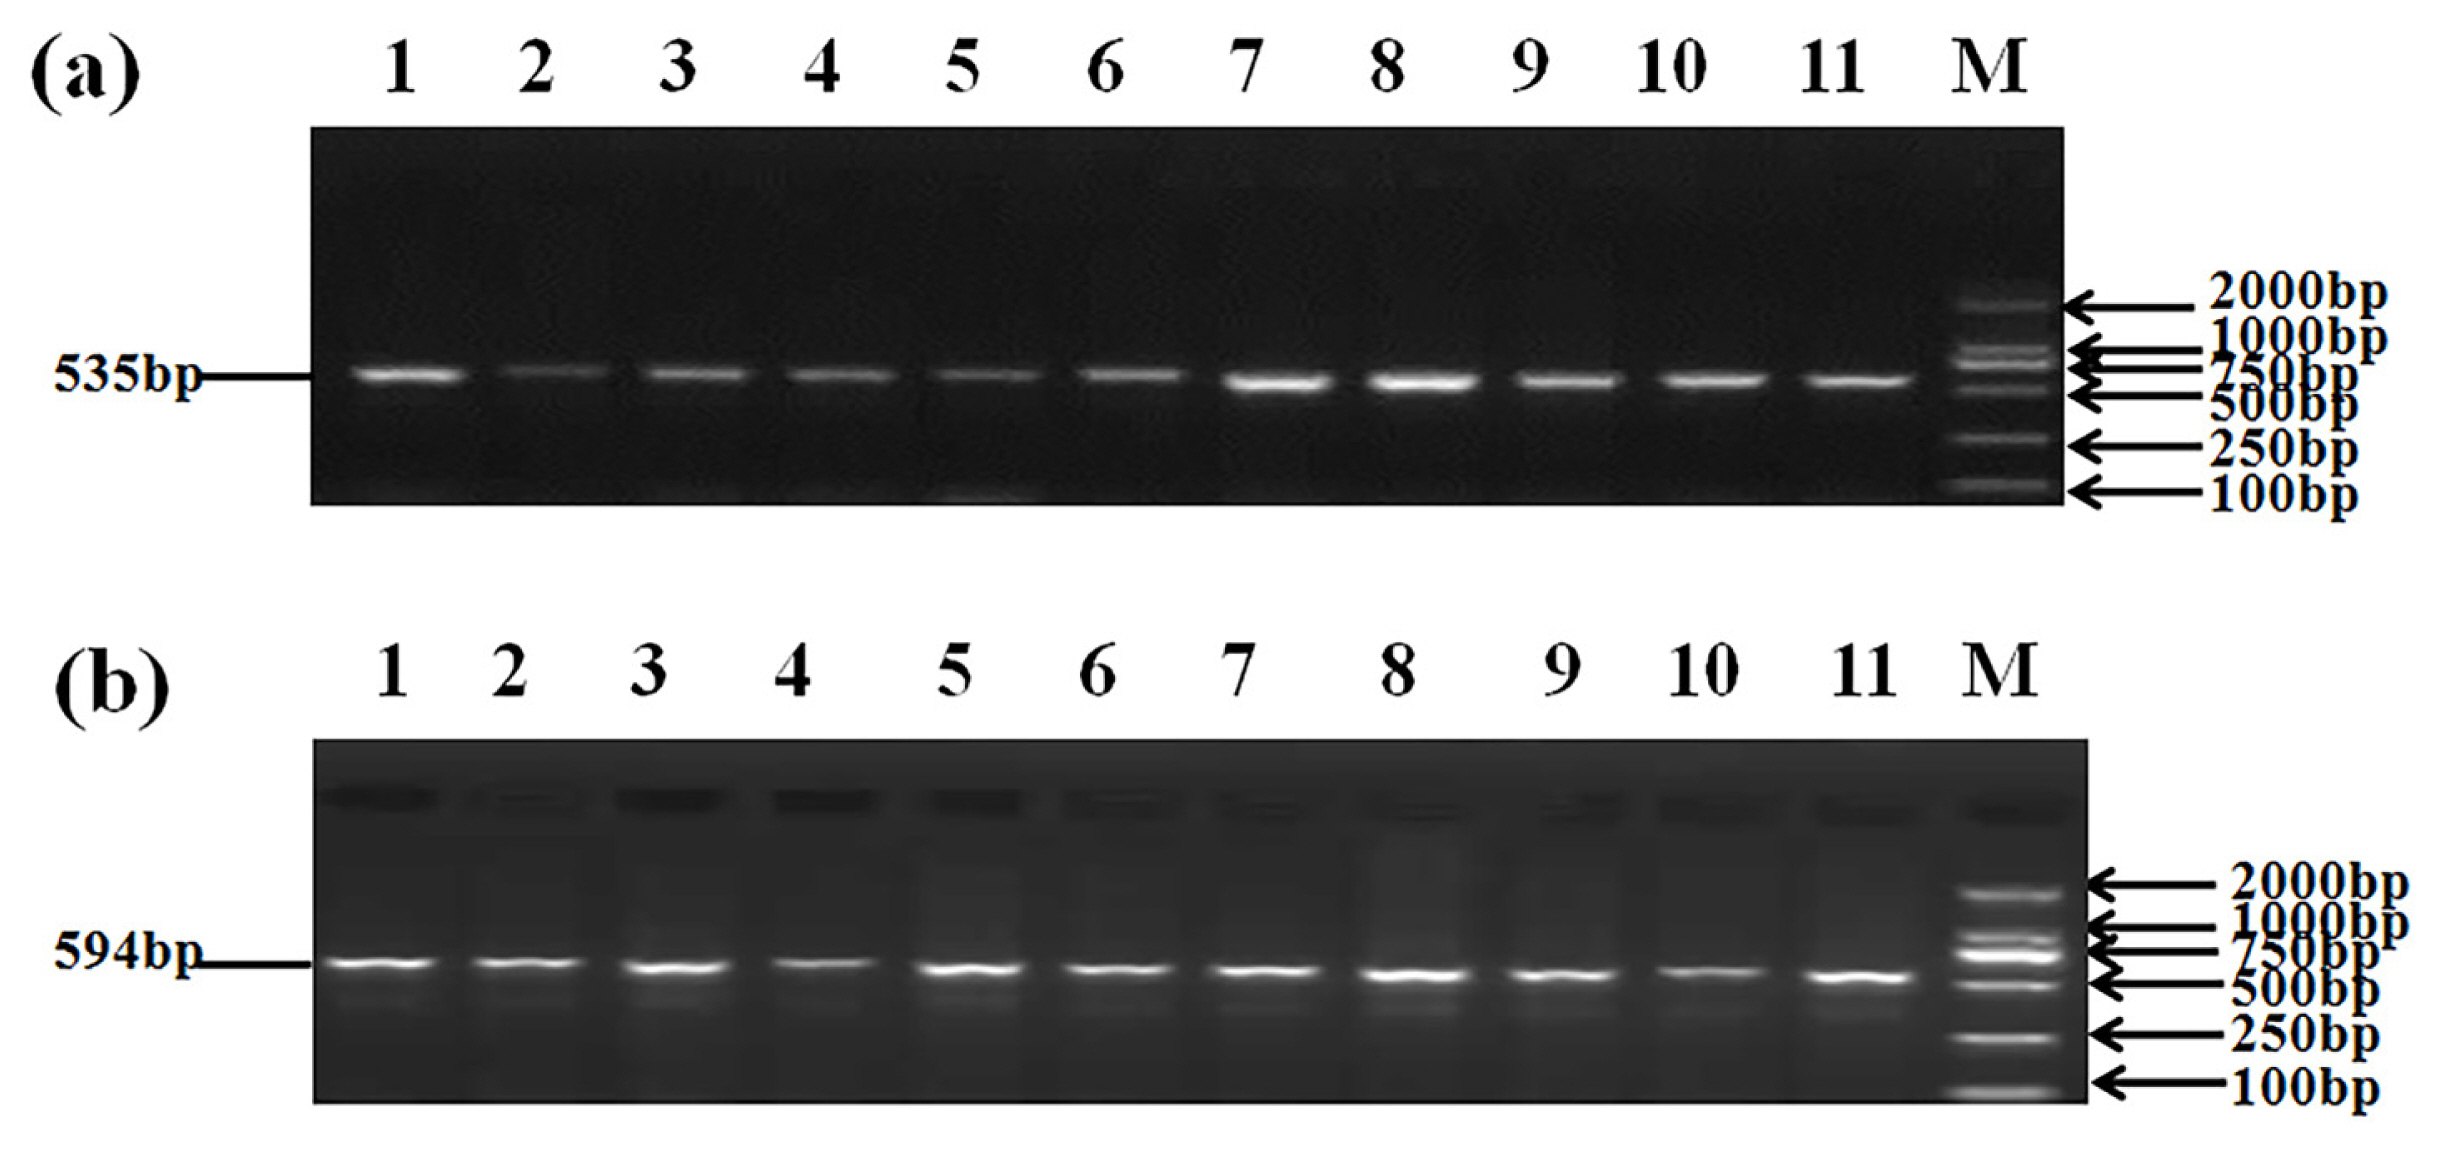
Based on the sequence of bovine GDF8 (GenBank accession number: NC_037329.1), two pairs of primers were designed for SNP scanning (Table 1). Five SNP sites were identified by PCR and sequencing, including two mutations in exon 1 (g.244C>G and g.400G>A), two mutations in exon 3 (g.5070C> A and g.5076T>C), and one mutation in the 3′untranslated region (UTR) (g.5148A>C). The PCR reactions were performed in a volume of 25 μL containing 20 ng of DNA template, 12.5 μL of 2×Taq Mix (including 0.1 U Taq polymerase/μL, 500 μM dNTP each, 20 mM Tris-HCl (pH8.3), 100 mM KCl, 3 mM MgCl2, PCR reaction enhancer, optimizer, and stabilizer, TIANGEN, China), 1.0 μL of each primer (100 ng/μL), and sterile water. DNA fragments were amplified using the following parameters: initial denaturation at 95°C for 5 minutes, 32 cycles of 94°C for 30 seconds, 56°C for 30 seconds, and 72°C for 30 seconds, followed by a final extension at 72°C for 2 minutes. These PCR products were electrophoresed on a 1.5% agarose gel stained with GeneGreen Nucleic Acid Dye (TIANGEN, China) in 1% Tris-borate-ethylenediaminetetraacetic acid buffer.

Statistical analysis

At the five SNP sites, the genotypic and allelic frequencies were counted from the genotype data. The Hardy-Weinberg equilibrium (HWE) of alleles was examined via a χ2 test, which was performed using the POPGENE 3.2 software package. Population genetic indexes including gene homozygosity (Ho), gene heterozygosity (He), effective allele numbers (Ne), and polymorphism information content (PIC) were calculated according to Chakraborty and Nei [12]. The Ho was calculated as −equation-, whereas He as He = 1–Ho. Linkage disequilibrium (LD) and haplotype construction were analyzed using SHEsis software (http://analysis.bio-x.cn/myAnalysis.php) [13,14]. D’ represents the different degrees of linkage, and r2>0.33 indicates a strong linkage between SNP sites [15].
The mean of body conformation traits was calculated using the Bonferroni method in the SPSS 24.0 (IBM Company, NY, USA) software package. The association between SNP markers, haplotype combinations, and body conformation traits was analyzed using a general linear model with Bonferroni method as follows:
yijk=u+gi+aj+sk+eijk [16]
Where yijk is the phenotypic observation, u is the population mean, gi is the fixed effect of animal genotype, aj is the fixed effect of age, sk is the random effect of sire, and eijk is the residual error. Finally, a Bonferroni correction was performed to determine the p-value. The data were expressed as the mean±standard error, and differences were considered significant at p<0.05.

RESULTS

Species homology, phylogenetic tree, and motif analysis

Our sequence analysis revealed that the cDNA in GDF8 consisted of an 1,128-bp open reading frame, flanked by 133-bp 5′UTR and 1,476-bp 3′UTR sequences. The coding sequence regions encoded a polypeptide of 375 amino acid residues with a molecular mass of 25.74 kD and an isoelectric point of 9.58. Table 2 shows that each of the 5′-donor and 3′-acceptor splice sites conformed to the GT-AG rule. Figure 1 shows the multiple sequence alignment in seven species (cattle, human, rat, goat, mouse, sheep, and pig). Similar structures including precursor protein containing signal peptide, TGFb_propeptide, and transforming growth factor-beta (TGFB) were often observed among species. On the other hand, the phylogenic analysis of seven species revealed that cattle were closest to goat and sheep for GDF8 sequence, whereas the pig, human, rat, and mouse were relatively distant from the cattle branch. (Figure 2). A total of 12 significant motifs were identified in the related groups based on analysis of the super-secondary structure of GDF8 (Figure 3).

Sequence variants and genetic diversity

Five SNPs were detected in GDF8. Figure 4 shows the agarose gel electrophoresis (1.5%) of PCR amplified products using F1R1 and F2R2 primers; Figure 5 shows the sequenced map of five SNPs in bovine GDF8. In exon 1, g.244C>G and g.400G>A were detected; in exon 3, g.5070C>A and g.5076T>C were detected; in the 3′UTR, g.5148A>C was detected. Except for the SNP in the 3′UTR, the SNPs in exon1 and exon3 were synonymous mutations (g.244C>G: glycine; g.400G>A: glutamicacid; g.5070C>A: isoleucine; g.5076T>C: tyrosine).
Table 3 shows the genotype frequency, allele frequency, HWE, and population diversity parameters of five SNPs in GDF8. Three genotypes were observed in all five SNPs. The diversity parameters indicated that the He values ranged from 0.425 to 0.472; the range of Ne values was from 1.738 to 1.892, and the PIC values ranged from 0.335 to 0.360. These data indicated that Dabieshan cattle have a medium level of genetic diversity at these five SNP sites. According to the χ2 statistic, the genotypic frequencies of the g.244C>G, g.400G>A, and g.5148A>C mutations were in Hardy–Weinberg equilibrium. The χ2 statistic for g.5070C>A and g.5076T>C indicated that they were in Hardy-Weinberg disequilibrium, which may be a consequence of artificial selection and the diversity of breeding methods employed.

Haplotype analysis

Table 4 presents the results of the LD analysis between SNP markers. We categorized r2 value of 0.33 or higher as strong LD. The r2 values between g.5070C>A, g.5076T>C and g.5148A>C in GDF8 were greater than 0.330, indicating that the three SNPs had strong LD in Dabieshan cattle. The mean of the r2 values between adjacent SNPs was 0.329, and the mean of D′ values between adjacent SNPs was 0.772.
Single-site association analysis has shown that haplotypes can contribute greatly to phenotypic variation [17]. Table 5 shows the result of haplotype analysis in Dabieshan cattle. Hap 1 (-CACTA-) showed the highest frequency (32%), whereas Hap 5 (-GGACC-) showed the lowest frequency (5%) in our analysis.

Association of markers with body conformation traits

Table 6 lists the association of SNPs with body conformation traits in Dabieshan cattle. For g.244C>G, animals with genotype GG had a significantly higher mean AGR compared with the other genotypes (p<0.05). For g.400G>A, the influence of GG genotype resulted in the highest mean HW compared with animals with genotype AA (p<0.05). For g.5070C>A site, animals carrying the AA genotype had significantly higher HH and AGR than those with the CC genotype (p<0.05). At the g.5076T>C locus, our study also found that animals with genotypes TT and CC had greater WH than animals with genotype TC (p<0.05), and animals with the genotype CC had greater HH than animals with other genotypes (p<0.05). At the g.5148A>C locus, animals with genotype CC exhibited greater HH than the animals with genotype AA and AC (p<0.05).

Association of combined haplotypes with body conformation traits

Table 7 shows the association of combined haplotypes with body conformation traits in Dabieshan cattle. The frequencies of combined haplotypes <5.0% were not considered. Dabieshan cattle with H1H1 resulted in the highest means for WH, HH, HG, AGR, and PBW compared with animals with other combined haplotypes (p<0.05).

DISCUSSION

In China, Dabieshan cattle are generally considered as an economically important local breed that is extensively farmed and produces a high quality product [1]. GDF8 has been shown to possess complex biological functions, especially in muscular development [3,4], bone metabolism [18], and body development. Many studies have shown that SNPs in GDF8 are associated with body conformation traits in goat [19], yak [20], horse [21], and cattle [6].
In this study, multiple sequence alignment indicated that GDF8 was highly homologous in seven species, suggesting that it may possess critically important functions. The results of the phylogenic analysis in this study were consistent with Wu et al [22], which showed that the GDF8 sequence of cattle was most like sheep and goat. Three genotypes were identified for the five SNPs, and the PIC indicated that GDF8 showed an intermediate level of polymorphism (0.25<PIC<0.5) in Chinese Dabieshan cattle. The r2-values above 1/3 (r2>0.33) indicate that LD was sufficiently strong for mapping [15]. The mean r2 indicated that LD among the g.5070C>A, g.5076T>C, and g.5148A>C sites was strong, and this may be attributed to the lower recombination and higher genotypic variation at these sites [23].
It was worth noting that, mutations of g.244C>G, g.400G>A, g.5070C>A, and g.5076T>C were synonymous polymorphisms in Dabieshan cattle. Our results were consistent with the study of Huang et al [24], which found that a silent mutation of the bovine sterol regulatory element-binding protein-1c (SREBP1c) gene was associated with cattle body weight. Our results were also consistent with those of Xu et al [25] who found that a ‘silent’ SNP (g. 4617 A>C) in PAX3 dramatically improves the WH and BL of Chinese Nanyang and Caoyuan cattle. As Hunt et al [26] reported, a silent mutation did not alter the protein primary structure; however, this mutation might affect protein folding, alter the function, and modify the cellular response to specific targets by affecting messenger RNA splicing, stability, and protein structure. The SNPs in the 3′ UTR may be within or in the vicinity of the microRNA (miRNA) binding site, which could impair the regulatory functions of the associated miRNA [27,28]. Bioinformatics analysis in the current study showed that g.5148A>C was upstream of the bta-miR-29abcd binding site (http://www.targetscan.org/vert/); this may alter the level of GDF8 gene expression and affect phenotypes [29,30]. These findings were consistent with studies of Guanzhong dairy goats [31].
The bovine GDF8 gene is localized on chromosome 2 and has three exons and two introns. In this study, we detected five SNPs in bovine GDF8 gene: g.244C>G, g.400G>A, g.5070C>A, g. 5076T>C, and g.5148A>C. Data analysis revealed that all five SNPs were significantly associated with their body conformation traits, and animals with the combined haplotype H1H1 (-GGGGCCTTAA-) had significantly improved body conformation traits than animals with other haplotypes. Hap1 (-CACTA-) might also be associated with enhanced body conformation traits in Chinese Dabieshan cattle. Hence, we suggest that the combined haplotype H1H1 (-GGGGCCTTAA-) could be used as a marker to aid the selection of desirable characteristics of Dabieshan cattle in breeding programs.

CONCLUSION

Dabieshan cattle are economically important local breed in China. In this study, five SNPs and their corresponding haplotypes were identified in Chinese Dabieshan cattle, and the association analysis revealed that all five loci were significantly associated with their body conformation traits. Our results indicated that the combined haplotype H1H1 (-GG GGCCTTAA-) could be used as a marker to improve the body conformation traits of Dabieshan cattle in breeding program. Given the complexity of cattle breeding, additional studies are needed to examine the functional effects of GDF8 functional effects on body conformation traits.

Notes

CONFLICT OF INTEREST

We certify that there is no conflict of interest with any financial organization regarding the material discussed in the manuscript.

FUNDING

This study was supported by the Innovative Construction Project of Anhui Province (S202003b06020001), National Natural Science Foundation of China (32002162), and China Agriculture Research System of MOF and MARA (CARS-37).

Figure 1
The multiple sequence alignment of growth differentiation factor 8 (GDF8) protein sequences among seven species of animals (cattle, Bos taurus NP_001001525.1; human, Homo sapiens NP_005250.1; rat, Rattus norvegicus NP_062024.1; goat, Capra hircus NP_001272666.1; mouse, Mus musculus NP_034964.1; sheep, Ovis aries NP_001009428.1; pig, Sus scrofa NP_999600.2). Signal peptide, starts at position 1 and ends at position 18; Pfam:TGFb_propeptide, a latent complex, consisting of the TGF-beta dimer non-covalently bound to LAP (latency associated peptide) plus a latent TGF-beta binding protein (LTBP), starts at position 37 and ends at position 266; TGFB, transforming growth factor-beta (TGF-beta) family, starts at position 281 and ends at position 375.
ab-21-0166f1.jpg
Figure 2
The phylogenetic tree of growth differentiation factor 8 (GDF8) protein sequences among seven species of animals (cattle, Bos taurus NP_001001525.1; human, Homo sapiens NP_005250.1; rat, Rattus norvegicus NP_062024.1; goat, Capra hircus NP_001272666.1; mouse, Mus musculus NP_034964.1; Sheep, Ovis aries NP_001009428.1; pig, Sus scrofa NP_999600.2).
ab-21-0166f2.jpg
Figure 3
The significant motifs of growth differentiation factor 8 (GDF8) protein sequences in seven species (cattle, Bos taurus NP_001001525.1; human, Homo sapiens NP_005250.1; rat, Rattus norvegicus NP_062024.1; goat, Capra hircus NP_001272666.1; mouse, Mus musculus NP_034964.1; sheep, Ovis aries NP_001009428.1; pig, Sus scrofa NP_999600.2).
ab-21-0166f3.jpg
Figure 4
Agarose gel electrophoresis (1.5%) of polymerase chain reaction amplified product of GDF8 gene in Dabieshan cattle specimens using (a) F1R1 primer and (b) F2R2 primer. Lanes 1 to 11 show amplification products of GDF8 gene and Lane M shows 2,000 bp DNA ladder. GDF8, growth differentiation factor 8.
ab-21-0166f4.jpg
Figure 5
The sequenced map of five single nucleotide polymorphisms in the bovine growth differentiation factor 8 (GDF8) gene. The red blocks indicate the mutation site.
ab-21-0166f5.jpg
Table 1
Primers used for polymerase chain reaction analysis in bovine GDF8
Primer name1) Primer sequence Annealing temperature (°C) Segment length (bp)
GDF8-F1 5′ –GGAAGAAGTAAGAACAAGGGA– 3′ 56 535
GDF8-R1 5′ – TCCTCCTTACATACAAGCCAG– 3′
GDF8-F2 5′ –TCTTCTTTCCTTTCCATACAG– 3′ 56 594
GDF8-R2 5′ –TACGATTTGTTTTGATGGTTA– 3′

GDF8, growth differentiation factor 8.

1) GDF8-F*, for forward; GDF8-R*, for reverse.

Table 2
The exon/intron organizations of bovine GDF8
Gene Number Exon size (bp) Intron size (bp) 5′ splice donor 3′ splice acceptor
GDF8 1 373 1,828 GGAGTgtgag tatagCTGAT
2 374 2,032 GACTGgtaag tacagACTCC
3 381 - - -

GDF8, growth differentiation factor 8.

Table 3
Population genetic diversity for SNPs in Dabieshan cattle
SNP Genotypic frequency Allelic frequency HWE Diversity parameter


1 2 3 A1 A2 χ2 p-value Ho He Ne PIC
SNP1 (g.244C>G) CC GC GG C G
0.12 0.42 0.46 0.33 0.67 0.29 0.867 0.560 0.440 1.786 0.343
SNP2 (g.400G>A) GG GA AA G A
0.10 0.43 0.47 0.32 0.68 0.06 0.972 0.575 0.425 1.738 0.335
SNP3 (g.5070C>A) CC CA AA C A
0.44 0.36 0.20 0.62 0.38 13.46 0.001 0.528 0.472 1.892 0.360
SNP4 (g.5076T>C) TT TC CC T C
0.50 0.34 0.16 0.67 0.33 13.91 0.001 0.557 0.443 1.795 0.345
SNP5 (g.5148A>C) AA AC CC A C
0.46 0.38 0.16 0.65 0.35 6.00 0.051 0.544 0.456 1.837 0.352

SNP, single nucleotide polymorphism; HWE, hardy-Weinberg equilibrium; χ2 statistic, Chi-square test value; Ho, genetic homozygosity; He, genetic heterozygosity; Ne, effective number of alleles; PIC, polymorphic information content.

Table 4
The result of linkage equilibrium analysis between SNP markers
Item D' r2
SNP1–SNP2 (g.244C>G - g.400G>A) 0.943 0.206
SNP1–SNP3 (g.244C>G - g.5070C>A) 0.780 0.191
SNP1–SNP4 (g.244C>G - g.5076T>C) 0.835 0.175
SNP1–SNP5 (g.244C>G - g.5148A>C) 0.815 0.188
SNP2–SNP3 (g.400G>A - g.5070C>A) 0.372 0.038
SNP2–SNP4 (g.400G>A - g.5076T>C) 0.533 0.062
SNP2–SNP5 (g.400G>A - g.5148A>C) 0.572 0.081
SNP3–SNP4 (g.5070C>A - g.5076T>C) 0.966 0.748
SNP3–SNP5 (g.5070C>A - g.5148A>C) 0.917 0.758
SNP4–SNP5 (g.5076T>C - g.5148A>C) 0.959 0.843

SNP, single nucleotide polymorphism.

The value of D'/r2 represents the degree of linkage between SNPs markers.

D' = 1, absolute linkage; D' = 0, linkage equilibrium; 0<D'<1, different degrees of linkage; r2>0.33 indicates a strong linkage between SNP markers.

Table 5
Haplotypes and their frequencies in Dabieshan cattle
Haplotype g.244C>G g.400G>A g.5070C>A g.5076T>C g.5148A>C Frequency (%)
Hap1 C A C T A 31.50
Hap2 G A A C C 23.80
Hap3 G G C T A 23.50
Hap4 G A C T A 5.80
Hap5 G G A C C 5.20

Hap1, CACTA; Hap2, GAACC; Hap3, GGCTA; Hap4, GACTA; Hap5, GGACC.

Haplotype with frequency <5.00% was ignored in analysis.

Table 6
Association of SNPs with body conformation traits in Dabieshan cattle
SNP Genotype Traits (mean±SE)

BL (cm) WH (cm) HH (cm) HG (cm) AGR (cm) HW (cm) PBW (cm)
SNP1 (g.244C > G) CC 128.07±1.03 110.90±0.57 109.89±0.49 147.97±0.93 163.79±1.54a 30.89±0.47 17.26±0.21
GC 126.56±0.91 110.37±0.59 109.00±0.51 148.21±0.93 167.17±1.32a 31.18±0.43 16.69±0.15
GG 125.39±1.05 109.40±0.66 110.80±0.58 148.39±1.72 171.78±1.70b 32.16±0.42 18.73±0.93
p-value 0.385 0.376 0.127 0.987 0.015 0.244 0.200
SNP2 (g.400G > A) GG 130.48±1.13 112.26±0.58 111.58±0.51 151.91±1.26 173.96±1.62 32.47±0.45a 18.37±0.28
GA 125.95±0.99 110.07±0.59 110.21±0.53 149.65±1.05 168.99±1.60 32.31±0.43a 18.58±1.12
AA 125.28±0.95 109.45±0.65 109.35±0.62 147.22±0.94 167.82±1.46 30.78±0.40b 16.89±0.27
p-value 0.070 0.140 0.257 0.058 0.216 0.034 0.292
SNP3 (g.5070C > A) CC 125.54±1.04 110.65±0.53 109.70±0.49a 149.47±1.06 165.80±1.52a 31.77±0.44 19.23±1.26
CA 126.51±0.95 109.26±0.69 109.71±0.53a 149.59±0.93 170.32±1.66ab 31.55±0.43 17.47±2.16
AA 125.82±0.97 109.77±0.74 112.54±0.76b 149.86±1.08 175.10±1.48b 31.10±0.45 17.40±1.15
p-value 0.808 0.344 0.028 0.980 0.004 0.755 0.372
SNP4 (g.5076T > C) TT 126.11±1.09 110.92±0.60a 110.03±0.49a 149.79±1.02 167.31±1.53 31.82±0.44 18.92±1.14
TC 126.16±0.98 108.55±0.64b 109.68±0.53a 149.30±0.99 170.53±1.72 31.54±0.45 17.52±1.24
CC 125.08±0.97 110.00±0.77a 112.83±0.82b 149.50±1.11 173.31±1.51 31.06±0.48 17.22±1.23
p-value 0.846 0.040 0.033 0.947 0.109 0.718 0.461
SNP5 (g.5148A > C) AA 126.21±0.99 110.96±0.52 110.23±0.47a 150.19±1.06 167.19±1.59 32.25±0.44 19.19±1.22
AC 125.94±1.03 108.74±0.67 109.60±0.54a 148.72±0.95 169.99±1.60 31.15±0.43 17.44±1.24
CC 125.29±0.98 110.11±0.79 112.80±0.83b 149.94±1.14 174.17±1.53 31.10±0.48 17.26±1.23
p-value 0.894 0.052 0.036 0.605 0.075 0.280 0.347

SNP, single nucleotide polymorphism; BL, body length; WH, wither height; HH, hip height; HG, heart girth; AGR, abdominal girth; HW, hip width; PBW, pin bone width.

a,b Means in the same column with different superscripts are significantly different (p<0.05).

Table 7
Associations of combined haplotype with body conformation traits in Dabieshan cattle
Combined haplotype Frequency BL (cm) WH (cm) HH (cm) HG (cm) AGR (cm) HW (cm) PBW (cm)
GCAAACCTAC (H1H2) 0.323 125.93±0.89 108.88±1.01b 110.01±0.97ab 148.36±1.21b 168.14±1.35b 30.33±0.86 17.19±0.50ab
GCAGCCTTAA (H1H3) 0.231 125.79±0.88 110.12±1.09ab 107.85±0.74b 149.27±1.47b 161.08±1.36b 31.69±0.57 16.77±0.64b
GGAAAACCCC (H2H2) 0.138 126.44±1.19 110.44±0.97ab 110.00±1.03ab 151.69±1.29ab 170.53±1.37ab 32.77±0.94 19.00±0.57a
CCAACCTTAA (H3H3) 0.121 128.86±0.95 110.29±0.95ab 108.83±0.81b 148.00±0.89b 166.05±1.56b 30.92±0.77 17.33±0.66ab
GGGGCCTTAA (H1H1) 0.104 128.11±1.01 112.17±0.88a 112.73±0.94a 154.06±1.16a 174.00±1.76a 33.38±0.48 19.00±0.64a
p-value 0.510 0.036 0.043 0.030 0.029 0.703 0.042

BL, body length; WH, wither height; HH, hip height; HG, heart girth; AG, abdominal girth; HW, hip width; PBW, pin bone width.

a,b Means in the same column with different superscripts indicate significant difference at p<0.05.

REFERENCES

1. China national commission of animal genetic resources. Animal genetic research in China, bovines. Beijing, China: Chinese Agricultural Press; 2010.

2. McPherron A, Lawler AM, Lee S. Regulation of skeletal muscle mass in mice by a new TGF-beta superfamily member. Nature 1997; 387:83–90. https://doi.org/10.1038/387083a0
crossref pmid
3. Thomas M, Langley B, Berry C, et al. Myostatin, a negative regulator of muscle growth, functions by inhibiting myoblast proliferation. J Biol Chem 2000; 275:40235–43. https://doi.org/10.1074/jbc.M004356200
crossref pmid
4. Grobet L, Martin LJ, Poncelet D, et al. A deletion in the bovine myostatin gene causes the double-muscled phenotype in cattle. Nat Genet 1997; 17:71–4. https://doi.org/10.1038/ng0997-71
crossref pmid
5. Bi Y, Feng B, Wang Z, et al. Myostatin (MSTN) gene indel variation and its associations with body traits in Shaanbei White Cashmere goat. Animals (Basel) 2020; 10:168 https://doi.org/10.3390/ani10010168
crossref pmid pmc
6. Yang DY. Study on molecular markers of growth and development in cattle by candidate genes [Doctor’s thesis]. Yangling, China: Northwest A&F University; 2006. https://kns.cnki.net/kcms/detail/detail.aspx?dbcode=CDFD&dbname=CDFD9908&filename=2007045937.nh&v=4qLJZdQU3mNqBeoVkZ584p%25mmd2FSYyXz0gtntkJLWt1NKZSxp8MzTIDc51MIIwb17uv3

7. Saitou N, Nei M. The neighbor-joining method: a new method for reconstructing phylogenetic trees. Mol Biol Evol 1987; 4:406–25. https://doi.org/10.1093/oxfordjournals.molbev.a040454
crossref pmid
8. Bailey TL, Boden M, Buske FA, et al. MEME SUITE: tools for motif discovery and searching. Nucleic Acids Res 2009; 37:W202–8. https://doi.org/10.1093/nar/gkp335
crossref pmid pmc
9. Marchler-Bauer A, Bo Y, Han L, et al. CDD/SPARCLE: functional classification of proteins via subfamily domain architectures. Nucleic Acids Res 2016; 45:D200–3. https://doi.org/10.1093/nar/gkw1129
crossref pmid pmc
10. Wang G, Zhang S, Wei S, et al. Novel polymorphisms of SIX4 gene and their association with body measurement traits in Qinchuan cattle. Gene 2014; 539:107–10. https://doi.org/10.1016/j.gene.2014.01.042
crossref pmid
11. Yang W, Wang Y, Fu C, Zan LS. Association study and expression analysis of MTNR1A as a candidate gene for body measurement and meat quality traits in Qinchuan cattle. Gene 2015; 570:199–204. https://doi.org/10.1016/j.gene.2015.06.012
crossref pmid
12. Chakraborty R, Nei M. Bottleneck effects on average heterozygosity and genetic distance with the stepwise mutation model. Evolution 1977; 31:347–56. https://doi.org/10.1111/j.1558-5646.1977.tb01017.x
crossref pmid
13. Slatkin M. Linkage disequilibrium—understanding the evolutionary past and mapping the medical future. Nat Rev Genet 2008; 9:477–85. https://doi.org/10.1038/nrg2361
crossref pmid pmc
14. Li Z, Zhang Z, He Z, et al. A partition-ligation-combination-subdivision EM algorithm for haplotype inference with multiallelic markers: update of the SHEsis (http://analysis.bio-x.cn). Cell Res 2009; 19:519–23. https://doi.org/10.1038/cr.2009.33
crossref pmid
15. Ardlie KG, Kruglyak L, Seielstad M. Patterns of linkage disequilibrium in the human genome. Nat Rev Genet 2002; 3:299–309. https://doi.org/10.1038/nrg777
crossref pmid
16. Gui LS, Raza SHA, Jia J. Analysis of the oxidized low density lipoprotein receptor 1 gene as a potential marker for carcass quality traits in Qinchuan cattle. Asian-Australas J Anim Sci 2019; 32:58–62. https://doi.org/10.5713/ajas.18.0079
crossref pmid
17. Akey J, Jin L, Xiong M. Haplotypes vs single marker linkage disequilibrium tests: what do we gain? Eur J Hum Genet 2001; 9:291–300. https://doi.org/10.1038/sj.ejhg.5200619
crossref pmid
18. Chen YS, Guo Q, Guo LJ, et al. GDF8 inhibits bone formation and promotes bone resorption in mice. Clin Exp Pharmacol Physiol 2017; 44:500–8. https://doi.org/10.1111/1440-1681.12728
crossref pmid
19. Na R, Ni WW, EGX , Zeng Y, Han YG, Huang YF. SNP screening of the MSTN gene and correlation analysis between genetic polymorphisms and growth traits in Dazu black goat. Anim Biotechnol 2020; 32:558–65. https://doi.org/10.1080/10495398.2020.1727915
crossref pmid
20. Liang CN, Yan P, Xing CF, et al. Association of single nucleotide polymorphism at intron 2 of MSTN gene with growth traits in yak. Journal of Huazhong Agricultural University 2011; 30:285–9. https://doi.org/10.13300/j.cnki.hnlkxb.2011.03.023
crossref
21. Tozaki T, Sato F, Hill EW, et al. Sequence variants at the myostatin gene locus influence the body composition of Thoroughbred horses. J Vet Med Sci 2011; 73:1617–24. https://doi.org/10.1292/jvms.11-0295
crossref pmid
22. Wu S, Ning Y, Raza SHA, et al. Genetic variants and haplotype combination in the bovine CRTC3 affected conformation traits in two Chinese native cattle breeds (Bos Taurus). Genomics 2019; 111:1736–44. https://doi.org/10.1016/j.ygeno.2018.11.028
crossref pmid
23. Wen YF, Zheng L, Niu H, et al. Exploring genotype-phenotype relationships of the CRABP2 gene on growth traits in beef cattle. Anim Biotechnol 2020; 31:42–51. https://doi.org/10.1080/10495398.2018.1531015
crossref pmid
24. Huang YZ, He H, Sun JJ, et al. Haplotype combination of SREBP-1c gene sequence variants is associated with growth traits in cattle. Genome 2011; 54:507–16. https://doi.org/10.1139/g11-016
crossref pmid
25. Xu Y, Cai H, Zhou Y, et al. SNP and haplotype analysis of paired box 3 (PAX3) gene provide evidence for association with growth traits in Chinese cattle. Mol Biol Rep 2014; 41:4295–303. https://doi.org/10.1007/s11033-014-3300-9
crossref pmid
26. Komar A. Single nucleotide polymorphisms. Methods in molecular biology (Methods and Protocols). Totowa, NJ, USA: 2009. 578:p. 23–39. https://doi.org/10.1007/978-1-60327-411-1_2
crossref
27. Nakano M, Mohri T, Fukami T, et al. Single-nucleotide polymorphisms in cytochrome P450 2E1 (CYP2E1) 3′-untranslated region affect the regulation of CYP2E1 by miR-570. Drug Metab Dispos 2015; 43:1450–7. https://doi.org/10.1124/dmd.115.065664
crossref pmid
28. Yie SM, Li LH, Xiao R, Librach CL. A single base-pair mutation in the 3′-untranslated region of HLA-G mRNA is associated with preeclampsia. Mol Hum Reprod 2008; 14:649–53. https://doi.org/10.1093/molehr/gan059
crossref pmid
29. Schwerin M, Maak S, Hagendorf A, Lengerken GV, Seyfert HM. A 3′-UTR variant of the inducible porcine hsp70.2 gene affects mRNA stability. Biochim Biophys Acta 2002; 1578:90–4. https://doi.org/10.1016/s0167-4781(02)00448-7
crossref pmid
30. Lee I, Ajay SS, Yook JI, et al. New class of microRNA targets containing simultaneous 5′-UTR and 3′-UTR interaction sites. Genome Res 2009; 19:1175–83. https://doi.org/10.1101/gr.089367.108
crossref pmid pmc
31. Hou J, An X, Song Y, Gao TY, Lei YN, Cao BY. Two mutations in the caprine MTHFR 3′UTR regulated by microRNAs are associated with milk production traits. PLoS One 2015; 10:e0133015 https://doi.org/10.1371/journal.pone.0133015
crossref pmid pmc
TOOLS
METRICS Graph View
  • 2 Web of Science
  • 1 Crossref
  •  0 Scopus
  • 3,634 View
  • 230 Download
Related articles

Genetics of heifer reproductive traits in Japanese Black cattle2020 February;33(2)


Editorial Office
Asian-Australasian Association of Animal Production Societies(AAAP)
Room 708 Sammo Sporex, 23, Sillim-ro 59-gil, Gwanak-gu, Seoul 08776, Korea   
TEL : +82-2-888-6558    FAX : +82-2-888-6559   
E-mail : editor@animbiosci.org               

Copyright © 2024 by Asian-Australasian Association of Animal Production Societies.

Developed in M2PI

Close layer
prev next