Go to Top Go to Bottom
Anim Biosci > Volume 32(12); 2019 > Article
Zhao, Chen, Xiao, Chen, Zhang, Wang, Zhen, and Qin: Prepartum body condition score affects milk yield, lipid metabolism, and oxidation status of Holstein cows

Abstract

Objective

This study aimed to investigate the effects of prepartum body condition score (BCS) on the milk yield, lipid metabolism, and oxidative status of Holstein cows.

Methods

A total of 112 multiparous Holstein cows were divided into 4 groups according to the BCS at 21 days before calving: medium BCS (3.0 to 3.25, MBCS), high BCS (3.5 to 3.75, HBCS), higher BCS (4.0 to 4.25, HerBCS), and highest BCS (4.5 to 5.0, HestBCS). Blood samples were collected on 21, 14, and 7 days before calving (precalving), on the calving day (calving), and on 7, 14, and 21 days after calving (postcalving). The indices of lipid metabolism and oxidative status were analyzed using bovine-specific enzyme-linked immunosorbent assay kit. Colostrum were taken after calving and analyzed by a refractometer and milk analyzer. The individual milk yield was recorded every 3 days.

Results

The density and levels of immune globulin and lactoprotein of colostrum from Holstein cows in the HestBCS group were the highest (p<0.05). These animals not only had the highest (p<0.05) levels of serum non-esterified fatty acids and beta-hydroxybutyrate, but also had the highest (p<0.05) levels of malondialdehyde, superoxide dismutase, catalase, vitamin A, and vitamin E. In addition, greater (p<0.05) BCS loss was observed in the HestBCS cows.

Conclusion

This study demonstrates that the milk yield, lipid metabolism, and oxidative status of Holstein cows are related to prepartum BCS and BCS loss during the transition period. HestBCS cows are more sensitive to oxidative stress and suffer greater loss of BCS after calving, whereas the MBCS animals had better milk yield performance.

INTRODUCTION

In the transition period, dairy cows experience oxidative stress and are susceptible to metabolic disorders and immunologic challenges [1,2]. At the time of early lactation, cows go through a period of negative energy balance (NEB) which may lead to oxidative stress and health problems in these animals [3]. Early lactation NEB not only decreases milk yield but also increased concentrations of non-esterified fatty acids (NEFA) and beta-hydroxybutyrate (BHBA) [4,5]. NEFA in the blood is mobilized from adipose tissue while BHBA is an intermediate metabolite of fatty acid oxidation [6]. NEFA and BHBA are considered to be biomarkers of NEB, and oxidative stress during the transition period [7,8]. The body condition score (BCS) is an assessment of body fat and reflects the NEB of Holstein dairy cows [9,10]. It was reported that the BCS of cows were associated with differences in milk production and composition, reproduction, and health [7,11]. Cows with higher BCS at calving had higher concentrations of NEFA [12,13] and BHBA [13] in early lactation compared these with lower BCS. Cows with higher BCS are more sensitive to oxidative stress [14,15]. Oxidative stress is mainly derived from an imbalance between reactive oxygen metabolites and antioxidants and the concentration of some oxidative status indices such as malondialdehyde (MDA) was higher in cows with higher BCS before calving [15].
But the change of BCS during the transition period and their effects on the health and subsequent performance of dairy cows was few systematically studied. Therefore, the relations between the BCS and milk production, lipid metabolism, oxidative status of dairy cows were investigated in the present study. Consequently, this study may be used as reference for the dairy farms to improve the animals’ health status and performance by adjusting prepartum BCS.

MATERIALS AND METHODS

Animals and experimental design

The trial was carried out at a commercial dairy farm with about 5,000 lactating cows in Dongying City, Shandong Province, P.R. China. The average milk yield per lactation of the cows was more than 40 kg (305 day). The BCS (5-point scale) was individually recorded 21 days before calving, on the calving day and 21 days after calving [9]. Multiparous Holstein cows (second or third lactation) were selected according to their BCS at 21 days before calving and divided into 4 groups (28 animals per group): medium BCS (3.0 to 3.25, MBCS), high BCS (3.5 to 3.75, HBCS), higher BCS (4.0 to 4.25, HerBCS), and highest BCS (4.5 to 5.0, HestBCS). The cows were given access to total mixed ration and water ad libitum. The cows received a far-off diet (1.33 Mcal/kg) from −60 d to −22 d, and a close-up diet (1.50 Mcal/kg) was offered during the last 21 d. From 4 to 6 days postpartum, cows were supplemented with propylene glycol (PG, 300 mL) as a gluconeogenic precursor for both treatment and prevention of ketosis during transition. Cows were fed lactation diet I until 21 d (1.78 Mcal/kg) and lactation diet II (1.83 Mcal/kg) from 22 d to 100 d and milked four times at approximately 6:00, 12:00, 18:00, and 0:00; the individual milk yield was recorded every 3 days. The compositions of the diets are shown in Table 1 [16]. All of the animal experimental procedures were approved by the Institutional Animal Care and Use Committee at Jilin Agricultural University.

Blood and milk samples

Blood was sampled via the coccygeal vein after morning feeding at days 21, 14, and 7 prepartum (precalving), day 0 (calving), and days 7, 14, and 21 postpartum (after calving). Serum was collected in (1.5 mL) after centrifuging at 2,000×g at 4°C for 10 min and stored at −20°C until analytical determination. Colostrum was taken immediately after calving, and the levels of lactoprotein, lactose, solid-not-fat, and ash were analyzed by a milk analyzer (Foss Electric, Hillerød, Denmark) while the density and immune globulin concentration were analyzed by a refractometer (Yucheng To You Optical Instruments Co. Ltd., Shandong, China). The concentrations of NEFA, BHBA, superoxide dismutase (SOD), MDA, catalase (CAT), vitamin A (VA) and vitamin E (VE) in serum were analyzed using commercial bovine specific enzyme-linked immunosorbent assay kits (Shanghai Enzyme-linked Biotechnology Co. Ltd., Shanghai, China) according to the instructions. Reaction is terminated by sulphuric acid. The color change is measured spectrophotometrically at a wavelength of 450 nm (Multiskan FC, Thermo scientific, Waltham, MA, USA) and calculated by comparing the optical density of the samples to the standard curve, respectively.

Statistical analysis

All of the data are presented as the means±standard error and were subjected to one-way analysis of variance (colostrum composition) and general linear model by SPSS computer software (SPSS Inc., Chicago, IL, USA). The specify model included BCS (MBCS, HBCS, HerBCS, and HestBCS), Time (precalving, calving, postcalving) and their interactions (BCS× time) as fixed effects and cow within the treatment as random effect. Statistical significance is defined when p values are less than 0.05. Pearson correlation coefficients among the detected parameters were also calculated.

RESULTS

Colostrum composition, milk yield, and body condition score loss

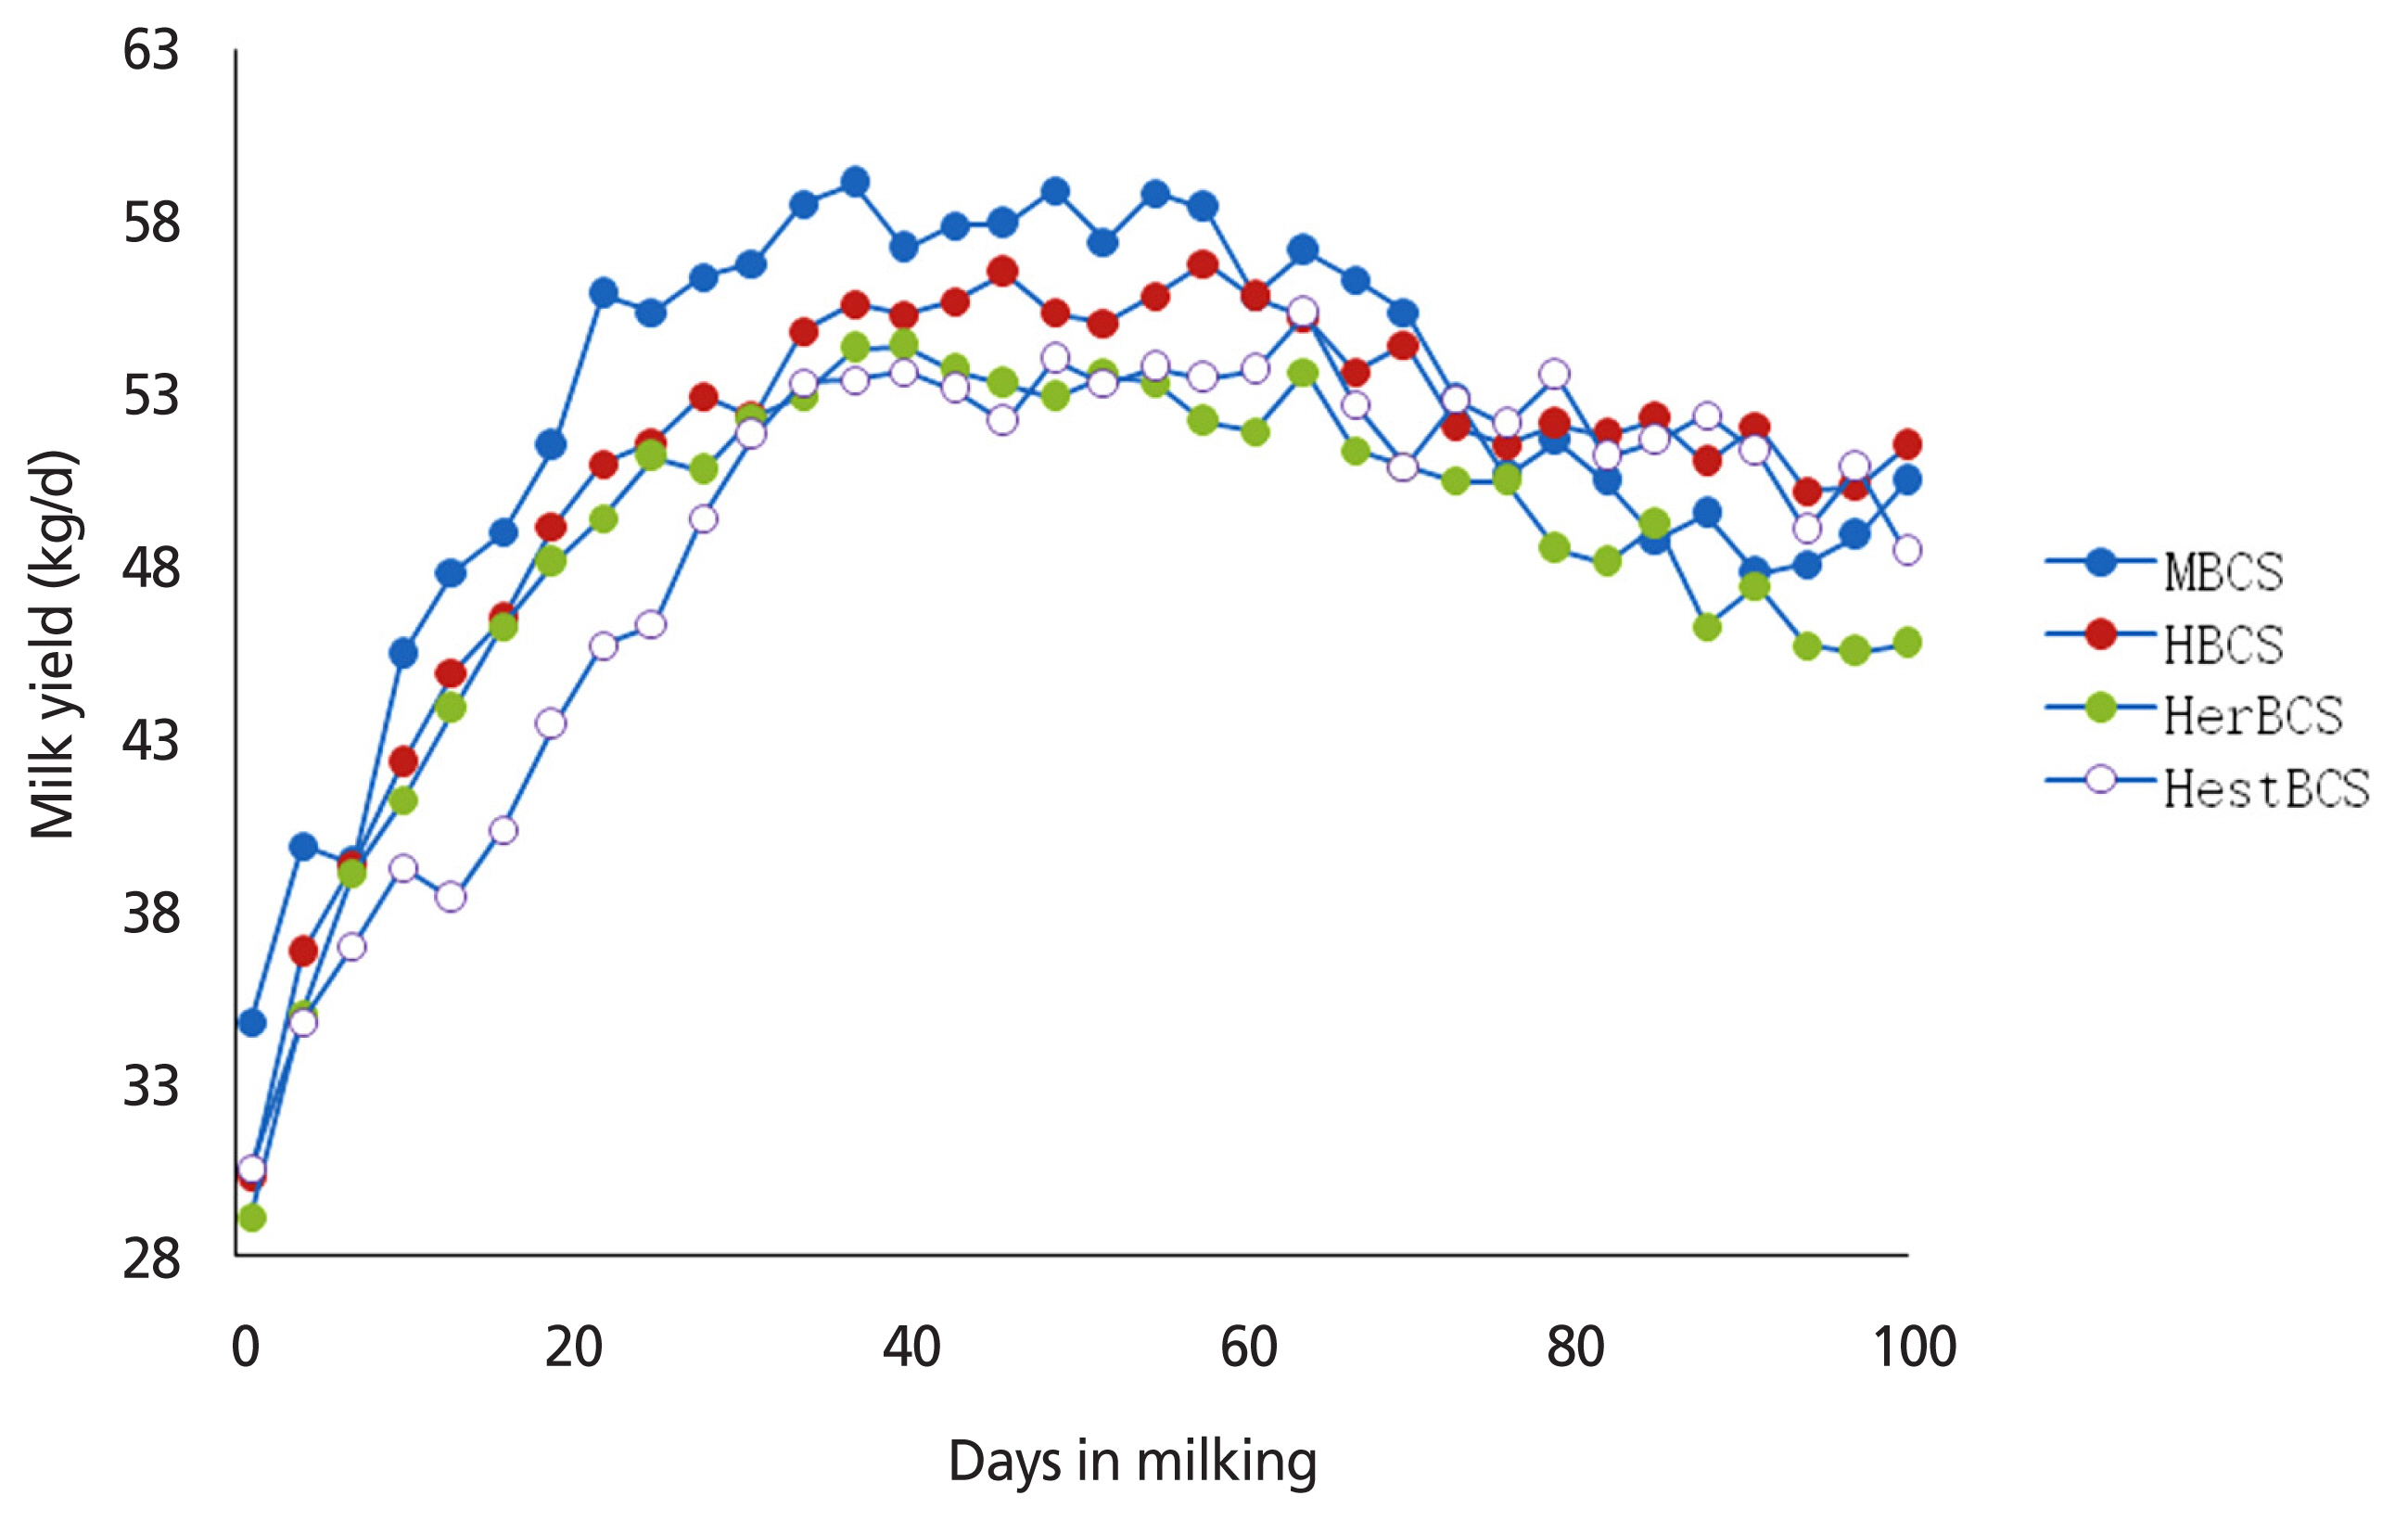
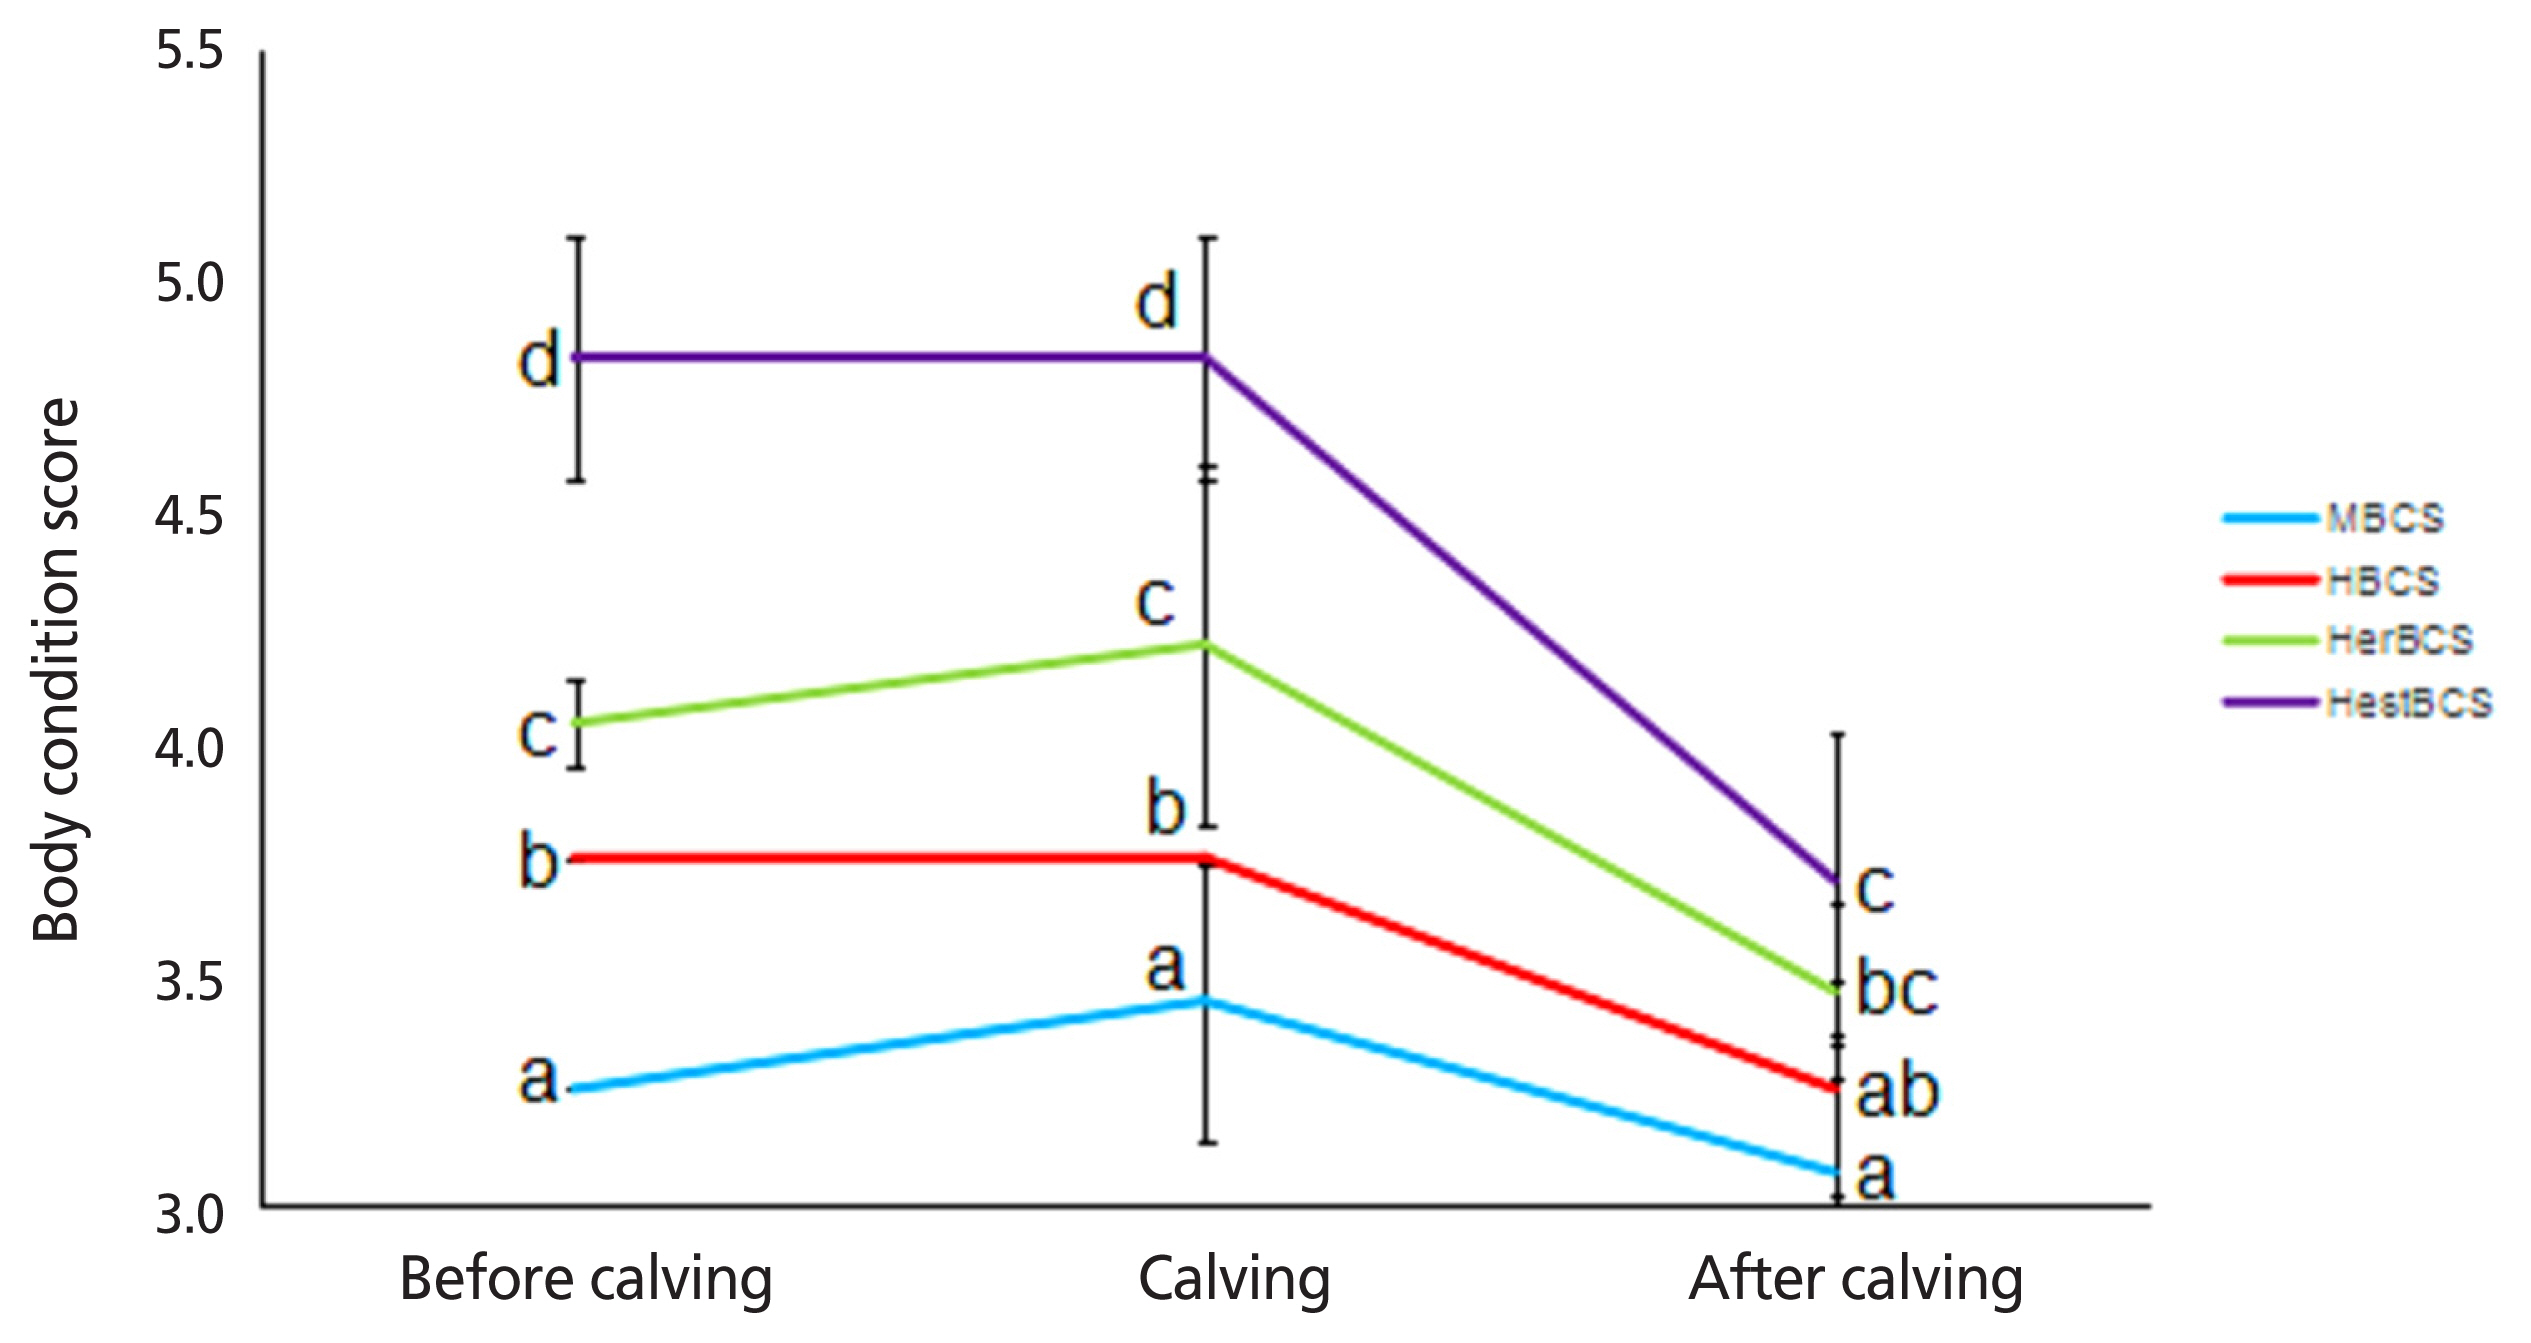
The density of colostrum and the levels of immune globulin and lactoprotein of cows in the HestBCS group were higher (p<0.05) than those in the other groups (Table 2). The milk yields of cows in the MBCS, HBCS, HerBCS, and HestBCS groups peaked (≥50 kg/d) at days 19 to 82, 22 to 100, 25 to 73, and 31 to 97, respectively. The average milk yields (0 to 100 days) were 52.35 kg/d, 50.94 kg/d, 48.59 kg/d, and 48.78 kg/d, respectively (Figure 1; Table 2). In addition, the present data showed that the animals in the HestBCS group had a greater BCS loss after calving (Figure 2). The percentages of lost BCS were 23.62% (HestBCS), 14.36% (HerBCS), 13.33% (HBCS), and 5.53% (MBCS) (Figure 2).

Lipid metabolism and oxidative status

NEFA was affected by both BCS (p<0.01) and time (p<0.01), while BHBA was only affected by BCS (p<0.01). There were no BCS×time effects on NEFA (p = 0.21) or BHBA (p = 0.97) during the transition period (Table 3). The serum levels of NEFA in cows in the HestBCS group on the calving day and after calving were all higher than those observed in other groups (p<0.05). In addition, the concentrations of BHBA were the highest (p<0.05) in HestBCS on precalving, calving, and postcalving days. Table 4 shows that MDA, SOD, and VA were affected by both BCS and time (p<0.05). There were BCS×time effects on SOD and VA during the transition period (p = 0.05). The concentrations of MDA, SOD, CAT, VA, and VE (except during precalving) in HestBCS (4.5 to 5.0) cows were all higher (p<0.05) than those in the other groups. Positive Pearson correlation coefficients were observed for NEFA (r = 0.260), BHBA (r = 0.496), MDA (r = 0.700), SOD (r = 0.606), CAT (r = 0.342), VA (r = 0.245), and VE (r = 0.448) to BCS (Table 5).

DISCUSSION

In early lactation, dairy cows experience a period of NEB due to the sudden increase in requirements of the mammary glands for milk production [17]. The mobilization of adipose tissue is associated with decreasing body weight (BW), and cows in transition with higher BCS lose more BW [18,19]. Similar results were observed in our study as the cows in the HestBCS group had the greatest BCS loss at 21 d after calving. Loker et al [20] suggested that lower production is associated with greater BCS. In our study, animals in the HestBCS group had a delayed peak milk yield. However, Dechow et al [21] found that fatter cows with more loss of BCS in early lactation have greater milk production. Milk composition is positively associated with BCS, and higher calving BCS means more protein and lactose during early lactation [22,23]. In our research, a higher level of lactoprotein was observed in HestBCS cows.
The NEFA and BHBA are commonly measured as indices of NEB and fat oxidization, and their concentrations during the early postpartum period are associated with BCS [10,19, 24,25]. The NEFA concentration in blood can be a reason for adipose tissue mobilization due to excess acetyl CoA generated from β-oxidation into ketone bodies, this leads to the loss of BCS [26,27]. In the present study, more rapid BCS loss and higher levels of NEFA and BHBA after calving were found in HestBCS cows, which is consistent with the results of Adrien et al [28]. Barletta et al [19] indicated that cows that lost BCS during the transition period had higher concentrations of NEFA and BHBA and more health events during the lactation. However, Mansouryar et al [23] fund that there was no significant differences in concentrations of NEFA and BHBA in high and normal BCS cows in early lactation. A BCS of 3.5 or higher at calving is associated with increased risk for ketosis [15], and a concentration of BHBA ≥1,200 μmol/L is considered as a sign of clinical ketosis [29,30]. However, no cows in the present study were diagnosed as ketotic at 1 week postpartum, as the BHBA concentrations were all lower than 1,200 μmol/L. This may be because choline (STA-CHOL) was added in the close-up diet [31] and PG was orally fed to cows at 4 days postpartum [32,33].
The MDA is the end product of the oxidative destruction of lipids, and its content can indicate the oxidative status of dairy cows [34,35]. In the present study, the highest level of MDA was found in HestBCS cows and MDA were increased on the calving day and decreased after calving. These data demonstrate that cows suffered the most serious oxidative stress on calving day and cows with higher BCS suffered much more serious oxidative stress than the other BCS cows before or after calving. It is probable that a negative association between BCS and dry matter intake in early lactation [36]. To maintain the requirements for milk production, prepartum cows with higher BCS experience more serious NEB [17].
The SOD is considered to be the first defense against pro-oxidants that convert the superoxide (O2) to hydrogen peroxide (H2O2) [37] and Bernabucci et al [38] used SOD in blood to assess the oxidative status of transition dairy cows. In the current study, HestBCS cows had the highest SOD concentrations. And the concentration of SOD was commonly higher on calving day which was similar to the report of Bernabucci et al [15]. CAT is a critical antioxidant enzyme that prevents the accumulation of H2O2 and is considered to be an index of antioxidative status [39,40]. In the present study, CAT and MDA showed positive correlations, which is consistent with a previous study [35].
The VA and VE are fat-soluble membrane antioxidants that are important for enhancing antioxidant defense systems against oxidative stress [41,42]. Jin et al [43] reported that a diet supplemented with VA increases the concentration of serum SOD and CAT, which is consistent with the results of the current study. The VE supplementation reduces oxidative damage in the livers of heifers [44] and mitigates oxidative stress in crossbred cows [45]. In the present study, an oxidative (NEFA, BHBH, MDA)-antioxidative (SOD, CAT, VA, VE) balance was obviously observed in the cows, which might be the result of homeostatic control.

CONCLUSION

This study indicates that the milk yield, lipid metabolism, and oxidative status of Holstein cows are related to prepartum BCS and BCS loss during the transition period. Holstein cows with MBCS have better milk yield performance after calving whereas the animals with HestBCS suffer greater BCS loss and higher oxidative stress. Our data may provide some theoretical basis for improving the postpartum health and performance of dairy cows by adjusting prepartum BCS.

Notes

CONFLICT OF INTEREST

We certify that there is no conflict of interest with any financial organization regarding the material discussed in the manuscript.

ACKNOWLEDGMENTS

The study was financially supported by Jilin Province Science and Technology Key Project (20160301003NY) and Jilin Province Feed Engineering and Technology Research Center (20170623075TC). The authors would like to thank Dr Yang Zhi Liu and Dr Zhe Sun for their helps during the submission.

Figure 1
Average milking yield of Holstein cows after calving (0 to 100 days).
ajas-18-0817f1.jpg
Figure 2
Body condition score of Holstein cows before calving, at calving, and after calving. ad Means in the same row followed by different superscripts differ at p<0.05. The same letter or no letter indicates no significant difference.
ajas-18-0817f2.jpg
Table 1
Ingredients (kg/head/d) and chemical composition (% of dry matter) of the experimental diets
Items Far-off diet (−60 d to −22 d) Close-up diet (−21 d to calving) Lactation diet I (calving to 21 d) Lactation diet II (22 d to 100 d)
Ingredients
 Corn silage 6.00 12.00 14.00 -
 Fermented rice straw 7.00 - - -
 Alfalfa hay - - 3.70 4.00
 Wet distilled grain solubles - 3.00 2.00 5.00
 Oat grass 6.00 3.80 0.50 -
 Steam-flaked corn - - 2.50 4.40
 Corn - 1.40 1.40 2.20
 Urea 0.04 0.05 0.04 0.07
 Soybean 0.70 0.50 1.50 2.30
 Spouting corn bran 0.50 - - -
 Soybean hull 0.50 0.70 0.80 -
 Rapeseed meal 1.30 1.00 - 0.50
 Extruded soybean - - - 0.50
 Premix I1) 0.20 - - -
 Premix II2) - 0.80 - -
 Premix III3) - - 0.68 0.68
 Fat powder - 0.15 0.30
 Rumen bypass protein - 0.50 1.20 1.20
 Diamond V XPC - 0.025 0.025 0.025
 STA-CHOL - 0.056 0.060 -
 Rumen-protected nicotine - 0.02 0.02 -
 KHCO3 - - 0.05 -
 Molasses - - 0.80 1.00
 Wet matter (kg/head/d) 22.24 23.85 29.42 45.18
 Dry matter intake (kg/head/d) 13.40 13.10 17.30 24.40
 Chemical composition
Acid detergent fiber 32.92 22.41 18.69 16.64
 NEl (Mcal/kg dry matter)4) 1.33 1.50 1.78 1.83
 Neutral detergent fiber 49.00 36.60 27.87 26.28
 Crude protein 13.00 13.85 16.40 17.36
 Starch 13.50 23.30 26.37 30.90
 Non-fiber carbohydrates 30.00 37.85 43.81 46.06
 Calcium 0.51 1.20 1.09 0.85
 Phosphorus 0.39 0.44 0.45 0.45

1) Nutrients provided/kg of additive: vitamin A, 700 kIU; vitamin D3, 200 kIU; vitamin E, 8,500 IU; Cu, 650 mg; Zn, 1,656 mg; Mn, 1,335.6 mg; Co, 40 mg; I, 80 mg; Se, 32 mg; CaCO3, 122 g; CaHPO4·2H2O, 34 g; NaCl, 120 g.

2) Nutrients provided/kg of additive: vitamin A, 400 kIU; vitamin D3, 100 kIU; vitamin E, 5,000 IU; Cu, 375 mg; Zn, 345 mg; Organic Zn, 225 mg; Mn, 508.8 mg; Co, 6 mg; I, 24 mg; Organic Se, 24 mg; Ca, 143.8 g; P, 13.6 g; Cl, 158.8 g; S, 49.6 g.

3) Nutrients provided/kg of additive: vitamin A, 400 kIU; vitamin D3, 150 kIU; vitamin E, 3,000 IU; Cu, 650 mg; Zn, 2,415 mg; Mn, 1,303.8 mg; Co, 24 mg; I, 60 mg; Se, 24 mg; Ca, 157.7 g; P, 32.3 g; NaCl, 130 g.

4) NEl (Mcal/kg DM) was calculated according to NRC [16].

Table 2
Influence of body condition score on the colostrum composition (%) and average milking yield (kg/d, 0 to 100 d) of Holstein cows
Variables MBCS (3.0 to 3.25) HBCS (3.5 to 3.75) HerBCS (4.0 to 4.25) HestBCS (4.5 to 5.0)
Density (%) 19.49±4.07a 20.30±3.19a 20.11±4.15a 29.39±2.77b
Immune globulin (%) 18.77±3.08a 18.31±3.22a 19.59±3.63a 27.34±3.92b
Lactoprotein (% 6.06±1.08a 5.75±1.38a 6.57±0.99ab 7.59±0.62b
Lactose (%) 8.84±1.14 8.26±1.88 9.21±1.38 9.22±1.61
Solid-not-fat (%) 16.52±2.18 17.12±2.05 18.64±1.52 20.06±1.45
Ash (%) 1.19±0.20 1.12±0.29 1.27±0.18 1.33±0.27
Average milking yield (kg/d) 52.35±7.03 50.94±7.42 48.59±3.83 48.78±5.43

MBCS, medium BCS (3.0 to 3.25); HBCS, high BCS (3.5 to 3.75); HerBCS, higher BCS (4.0 to 4.25); HestBCS, highest BCS (4.5 to 5.0).

a,b Means in the same row followed by different superscripts differ at p<0.05.

Table 3
Influence of body condition score on the levels of non-esterified fatty acid (NEFA) and beta-hydroxybutyrate (BHBA) of Holstein cows
Variables Treatments1) p-vale


MBCS (3.0 to 3.25) HBCS (3.5 to 3.75) HerBCS (4.0 to 4.25) HestBCS (4.5 to 5.0) BCS Time BCS×time
NEFA (μmol/L) Precalving 1,372.50±309.31B 1,412.50±311.67B 1,535.00±351.96B 1,730.00±446.29 <0.01 <0.01 0.21
Calving 871.14±101.89aA 774.00±159.33aA 833.00±126.91aA 1,369.0±137.25b
Postcalving 1,510.20±270.87bB 900.50±147.92aA 889.75±124.59aA 1,632.50±153.60b
BHBA (μmol/L) Precalving 322.13±49.80a 347.96±64.95a 409.32±58.72a 571.37±68.07b <0.01 0.61 0.97
Calving 345.75±34.87a 324.50±52.98a 345.83±60.62a 549.92±89.82b
Postcalving 369.01±50.22a 343.23±47.27a 388.38±83.62a 559.71±66.13b

BCS, body condition score.

1) MBCS, medium BCS (3.0 to 3.25); HBCS, high BCS (3.5 to 3.75); HerBCS, higher BCS (4.0 to 4.25); HestBCS, highest BCS (4.5 to 5.0).

a,b Means in the same row followed by different superscripts differ at p<0.05.

A,B Means in the same column followed by different superscripts differ at p<0.05.

Table 4
Influence of body condition score on oxidative status of Holstein cows
Variables Treatments1) p-value


MBCS (3.0 to 3.25) HBCS (3.5 to 3.75) HerBCS (4.0 to 4.25) HestBCS (4.5 to 5.0) BCS Time BCS×time
MDA (nmol/mL) Precalving 8.75±2.37a 8.84±1.49aAB 9.05±1.28aAB 12.64±1.81bB <0.01 <0.05 0.16
Calving 9.13±1.19a 9.48±1.16aB 9.54±2.1aB 17.17±2.42bC <0.01
Postcalving 8.59±1.97ab 6.93±1.96aA 6.69±1.52aA 10.03±1.23bA <0.01
SOD (U/mL) Precalving 177.40±27.52a 171.08±22.67aB 180.14±18.03aB 256.79±25.84bA <0.01 <0.05 0.05
Calving 191.46±32.91a 177.01±23.70aB 192.71±25.65aB 348.58±23.43bB <0.01
Postcalving 183.98±24.94b 125.09±19.07aA 131.74±20.74aA 216.57±26.10cA <0.01
CAT (U/mL) Precalving 139.96±27.46a 137.81±28.03a 132.66±18.75a 196.25±32.81b <0.01 0.51 0.47
Calving 126.49±18.16a 120.44±18.30a 119.56±13.79a 198.61±20.01b <0.01
Postcalving 148.05±27.20a 122.45±45.15a 144.79±59.91a 207.02±45.58b <0.01
VA (ng/mL) Precalving 79.45±15.02aB 61.36±20.36aA 62.24±21.59aA 113.15±25.84bA <0.01 <0.05 0.05
Calving 65.60±11.42aB 64.89±13.09aA 71.44±13.44aA 123.20±19.61bAB
Postcalving 62.22±12.64aA 108.88±11.37bB 123.63±24.73bB 135.30±9.55cAB
VE (ug/mL) Precalving 35.24±5.99B 29.54±6.51 29.12±6.43 36.90±9.51 <0.01 0.13 0.37
Calving 33.55±5.79aB 32.15±2.34a 36.17±9.96a 46.70±9.31b
Postcalving 26.09±5.21aA 30.14±8.91a 31.93±8.32ab 40.62±9.39b

BCS, body condition score; MDA, malondialdehyde; SOD, oxidase dismutase; CAT, catalase; VA, vitamin A; VE, vitamin E.

1) MBCS, medium BCS (3.0 to 3.25); HBCS, high BCS (3.5 to 3.75); HerBCS, higher BCS (4.0 to 4.25); HestBCS, highest BCS (4.5 to 5.0).

a,b Means in the same row followed by different superscripts differ at p<0.05.

A,B Means in the same column followed by different superscripts differ at p<0.05.

Table 5
Pearson correlation coefficients of the levels of non-esterified fatty acid and beta-hydroxybutyrate, and indices of oxidative status and body condition score of Holstein cows
NEFA BHBA MDA SOD CAT VA VE BCS
NEFA -
BHBA 0.572** -
MDA 0.468** 0.764** -
SOD 0.379** 0.624** 0.781** -
CAT 0.524** 0.750** 0.585** 0.594** -
VA 0.354** 0.636** 0.375** 0.487** 0.512** -
VE 0.417** 0.788** 0.741** 0.671** 0.527** 0.639** -
BCS 0.260* 0.496** 0.700** 0.606** 0.342** 0.245* 0.448** -

NEFA, non-esterified fatty acid; BHBA, beta-hydroxybutyrate; MDA, malondialdehyde; SOD, oxidase dismutase; CAT, catalase; VA, vitamin A; VE, vitamin E; BCS: body condition score.

* p<0.05,

** p<0.01.

REFERENCES

1. Esposito G, Irons PC, Webb EC, Chapwanya A. Interactions between negative energy balance, metabolic diseases, uterine health and immune response in transition dairy cows. Anim Reprod Sci 2013; 144:60–71. https://doi.org/10.1016/j.anireprosci.2013.11.007
crossref pmid
2. Alharthi A, Zhou Z, Lopreiato V, Trevisi E, Loor JJ. Body condition score prior to parturition is associated with plasma and adipose tissue biomarkers of lipid metabolism and inflammation in Holstein cows. J Anim Sci Biotechnol 2018; 9:12 https://doi.org/10.1186/s40104-017-0221-1
crossref pmid pmc pdf
3. De Bie J, Langbeen A, Verlaet AAJ, et al. The effect of a negative energy balance status on β-carotene availability in serum and follicular fluid of nonlactating dairy cows. J Dairy Sci 2016; 99:5808–19. https://doi.org/10.3168/jds.2016-10870
crossref pmid
4. Carlson DB, Litherland NB, Dann HM, Woodworth JC, Drackley JK. Metabolic effects of abomasal l-carnitine infusion and feed restriction in lactating Holstein cows. J Dairy Sci 2006; 89:4819–34. https://doi.org/10.3168/jds.S0022-0302(06)72531-0
crossref pmid
5. Gross J, van Dorland HA, Bruckmaier RM, Schwarz FJ. Performance and metabolic profile of dairy cows during a lactational and deliberately induced negative energy balance with subsequent realimentation. J Dairy Sci 2011; 94:1820–30. https://doi.org/10.3168/jds.2010-3707
crossref pmid
6. Enjalbert F, Nicot MC, Bayourthe C, Moncoulon R. Ketone bodies in milk and blood of dairy cows: Relationship between concentrations and utilization for detection of subclinical ketosis. J Dairy Sci 2001; 84:583–9. https://doi.org/10.3168/jds.S0022-0302(01)74511-0
crossref pmid
7. Roche JR, Berry DP. Periparturient climatic, animal, and management factors influencing the incidence of milk fever in grazing systems. J Dairy Sci 2006; 89:2775–83. https://doi.org/10.3168/jds.S0022-0302(06)72354-2
crossref pmid
8. Ospina PA, Nydam DV, Stokol T, Overton TR. Associations of elevated nonesterified fatty acids and β-hydroxybutyrate concentrations with early lactation reproductive performance and milk production in transition dairy cattle in the northeastern United States. J Dairy Sci 2010; 93:1596–603. https://doi.org/10.3168/jds.2009-2852
crossref pmid
9. Edmonson AJ, Lean IJ, Weaver LD, Farver T, Webster G. A body condition scoring chart for Holstein dairy cows. J Dairy Sci 1989; 72:68–78. https://doi.org/10.3168/jds.S0022-0302(89)79081-0
crossref
10. Giuliodori MJ, Delavaud C, Chilliard Y, Becú-Villalobos D, Lacau-Mengido I, de la Sota RL. High NEFA concentrations around parturition are associated with delayed ovulations in grazing dairy cows. Livest Sci 2011; 141:123–8. https://doi.org/10.1016/j.livsci.2011.05.007
crossref
11. Chebel RC, Mendonça LG, Baruselli PS. Association between body condition score change during the dry period and postpartum health and performance. J Dairy Sci 2018; 101:4595–614. https://doi.org/10.3168/jds.2017-13732
crossref pmid pdf
12. Pires JAA, Delavaud C, Faulconnier Y, Pomies D, Chilliard Y. Effects of body condition score at calving on indicators of fat and protein mobilization of periparturient Holstein-Friesian cows. J Dairy Sci 2013; 96:6423–39. https://doi.org/10.3168/jds.2013-6801
crossref pmid
13. Akbar H, Grala TM, Riboni MV, et al. Body condition score at calving affects systemic and hepatic transcriptome indicators of inflammation and nutrient metabolism in grazing dairy cows. J Dairy Sci 2015; 98:1019–32. https://doi.org/10.3168/jds.2014-8584
crossref pmid
14. Laubenthal L, Ruda L, Sultana N, et al. Effect of increasing body condition on oxidative stress and mitochondrial biogenesis in subcutaneous adipose tissue depot of nonlactating dairy cows. J Dairy Sci 2017; 100:4976–86. https://doi.org/10.3168/jds.2016-12356
crossref pmid
15. Bernabucci U, Ronchi B, Lacetera N, Nardone A. Influence of body condition score on relationships between metabolic status and oxidative stress in periparturient dairy cows. J Dairy Sci 2005; 88:2017–26. https://doi.org/10.3168/jds.S0022-0302(05)72878-2
crossref pmid
16. National Research Council. Nutrient requirements of dairy cattle. 7th edWashington, DC, USA: National Academy Press; 2001.

17. Vailati-Riboni M, Kanwal M, Bulgari O, et al. Body condition score and plane of nutrition prepartum affect adipose tissue transcriptome regulators of metabolism and inflammation in grazing dairy cows during the transition period. J Dairy Sci 2016; 99:758–70. https://doi.org/10.3168/jds.2015-10046
crossref pmid
18. Treacher RJ, Reid IM, Roberts CJ. Effect of body condition at calving on the health and performance of dairy cows. Anim Sci 1986; 43:1–6. https://doi.org/10.1017/S0003356100018286
crossref
19. Barletta RV, Maturana Filho M, Carvalho PD, et al. Association of changes among body condition score during the transition period with NEFA and BHBA concentrations, milk production, fertility, and health of Holstein cows. Theriogenology 2017; 104:30–6. https://doi.org/10.1016/j.theriogenology.2017.07.030
crossref pmid
20. Loker S, Miglior F, Koeck A, et al. Relationship between body condition score and health traits in first-lactation Canadian Holsteins. J Dairy Sci 2012; 95:6770–80. https://doi.org/10.3168/jds.2012-5612
crossref pmid
21. Dechow CD, Rogers GW, Clay JS. Heritability and correlations among body condition score loss, body condition score, production and reproductive performance. J Dairy Sci 2002; 85:3062–70. https://doi.org/10.3168/jds.S0022-0302(02)74393-2
crossref pmid
22. Roche JR, Macdonald KA, Schütz KE, et al. Calving body condition score affects indicators of health in grazing dairy cows. J Dairy Sci 2013; 96:5811–25. https://doi.org/10.3168/jds.2013-6600
crossref pmid
23. Mansouryar M, Mirzaei-Alamouti H, Banadaky MD, Nielsen MO. Calving body condition score combined with milk test data and rectal tempreture improved the prognostic value of non-invasive markers for infectious diseases in Holestein cows. Livest Sci 2018; 212:69–74. https://doi.org/10.1016/j.livsci.2018.03.021
crossref
24. Gillund P, Reksen O, Gröhn YT, Karlberg K. Body condition related to ketosis and reproductive performance in Norwegian dairy cows. J Dairy Sci 2001; 84:1390–6. https://doi.org/10.3168/jds.S0022-0302(01)70170-1
crossref pmid
25. Jackson RA, Wills JR, Kendall NR, Green MJ, Murray RD, Dobson H. Energy metabolites in pre-and postpartum dairy cattle as predictors of reproductive disorders. Vet Rec 2011; 168:562 http://dx.doi.org/10.1136/vr.d1565
crossref pmid
26. Bell AW. Regulation of organic nutrient metabolism during transition from late pregnancy to early lactation. J Anim Sci 1995; 73:2804–19. https://doi.org/10.2527/1995.7392804x
crossref pmid
27. Herdt TH. Ruminant adaptation to negative energy balance: influences on the etiology of ketosis and fatty liver. Vet Clin North Am Food Anim Pract 2000; 16:215–30. https://doi.org/10.1016/S0749-0720(15)30102-X
crossref pmid
28. Adrien ML, Mattiauda DA, Artegoitia V, et al. Nutritional regulation of body condition score at the initiation of the transition period in primiparous and multiparous dairy cows under grazing conditions: milk production, resumption of post-partum ovarian cyclicity and metabolic parameters. Animal 2012; 6:292–9. https://doi.org/10.1017/S175173111100142X
crossref pmid
29. Suthar VS, Canelas-Raposo J, Deniz A, Heuwieser W. Prevalence of subclinical ketosis and relationships with postpartum diseases in European dairy cows. J Dairy Sci 2013; 96:2925–38. https://doi.org/10.3168/jds.2012-6035
crossref pmid
30. Shin EK, Jeong JK, Choi IS, et al. Relationships among ketosis, serum metabolites, body condition, and reproductive outcomes in dairy cows. Theriogenology 2015; 84:252–60. https://doi.org/10.1016/j.theriogenology.2015.03.014
crossref pmid
31. Lima FS, Sa Filho MF, Greco LF, Santos JEP. Effects of feeding rumen-protected choline on incidence of diseases and reprouction of dairy cows. Vet J 2012; 193:140–5. https://doi.org/10.1016/j.tvjl.2011.09.019
crossref pmid
32. Christensen JO, Grummer RR, Rasmussen FE, Bertics SJ. Effect of method of delivery of propylene glycol on plasma metabolites of feed-restricted cattle. J Dairy Sci 1997; 80:563–8. https://doi.org/10.3168/jds.S0022-0302(97)75971-X
crossref pmid
33. Piantoni P, Allen MS. Evaluation of propylene glycol and glycerol infusions as treatments for ketosis in dairy cows. J Dairy Sci 2015; 98:5429–39. https://doi.org/10.3168/jds.2015-9476
crossref pmid
34. Castillo C, Hernandez J, Valverde I, et al. Plasma malonaldehyde (MDA) and total antioxidant status (TAS) during lactation in dairy cows. Res Vet Sci 2006; 80:133–9. https://doi.org/10.1016/j.rvsc.2005.06.003
crossref pmid
35. Sharma N, Singh NK, Singh OP, Pandey V, Verma PK. Oxidative stress and antioxidant status during transition period in dairy cows. Asian-Australas J Anim Sci 2011; 24:479–84. https://doi.org/10.5713/ajas.2011.10220
crossref pdf
36. Garnsworthy P, Topps J. The effects of body condition at calving, food intake and performance in early lactation on blood composition of dairy cows given complete diets. Anim Sci 1982; 35:121–5. https://doi.org/10.1017/S000335610000088X
crossref
37. Halliwell B, Chirico S. Lipid peroxidation: its mechanism, measurement, and significance. Am J Clin Nutr 1993; 57:715S–25S. https://doi.org/10.1093/ajcn/57.5.715S
crossref pmid pdf
38. Bernabucci U, Ronchi B, Lacetera N, Nardone A. Markers of oxidative status in plasma and erythrocytes of transition dairy cows during hot season. J Dairy Sci 2002; 85:2173–9. https://doi.org/10.3168/jds.S0022-0302(02)74296-3
crossref pmid
39. Glorieux C, Sandoval JM, Fattaccioli A, et al. Chromatin remodeling regulates catalase expression during cancer cells adaptation to chronic oxidative stress. Free Radic Biol Med 2016; 99:436–50. https://doi.org/10.1016/j.freeradbiomed.2016.08.031
crossref pmid
40. Li Y, Wei L, Cao J, et al. Oxidative stress, DNA damage and antioxidant enzyme activities in the pacific white shrimp (Litopenaeus vannamei) when exposed to hypoxia and reoxygenation. Chemosphere 2016; 144:234–40. https://doi.org/10.1016/j.chemosphere.2015.08.051
crossref pmid
41. Ibrahim W, Lee US, Yeh CC, Szabo J, Bruckner G, Chow CK. Oxidative stress and antioxidant status in mouse liver: effects of dietary lipid, vitamin E and iron. J Nutr 1997; 127:1401–6. https://doi.org/10.1093/jn/127.7.1401
crossref pmid pdf
42. Kleczkowski M, Kluciński W, Sikora J, Zdanowicz M. Role of antioxidants in the protection against oxidative stress in cattle--trace elements and enzymatic mechanisms (Part 3). Pol J Vet Sci 2004; 7:233–40.
pmid
43. Jin L, Yan S, Shi B, et al. Effects of vitamin A on the milk performance, antioxidant functions and immune functions of dairy cows. Anim Feed Sci Technol 2014; 192:15–23. https://doi.org/10.1016/j.anifeedsci.2014.03.003
crossref
44. Bouwstra RJ, Goselink RMA, Dobbelaar P, Nielen M, Newbold JR, Van Werven T. The relationship between oxidative damage and vitamin E concentration in blood, milk, and liver tissue from vitamin E supplemented and nonsupplemented periparturient heifers. J Dairy Sci 2008; 91:977–87. https://doi.org/10.3168/jds.2007-0596
crossref pmid
45. Khatti A, Mehrotra S, Patel PK, et al. Supplementation of vitamin E, selenium and increased energy allowance mitigates the transition stress and improves postpartum reproductive performance in the crossbred cow. Theriogenology 2017; 104:142–8. https://doi.org/10.1016/j.theriogenology.2017.08.014
crossref pmid


Editorial Office
Asian-Australasian Association of Animal Production Societies(AAAP)
Room 708 Sammo Sporex, 23, Sillim-ro 59-gil, Gwanak-gu, Seoul 08776, Korea   
TEL : +82-2-888-6558    FAX : +82-2-888-6559   
E-mail : editor@animbiosci.org               

Copyright © 2024 by Asian-Australasian Association of Animal Production Societies.

Developed in M2PI

Close layer
prev next