


INTRODUCTION
Goats, one of the most ancient livestock species, were domesticated ~10,000 years ago in Southwestern Asia [1]. It is widely accepted that Chinese indigenous goat breeds originated from the plateau of Southwest China and nearby regions in central Asia. About 39% of documented mammalian livestock breeds are goats, but 7% of known goat breeds are extinct and 20% are threatened. Long-term natural and artificial selection, imposed by environmental changes and animal husbandry, have resulted in 58 indigenous and 8 cultivated goat breeds. A considerable number of desirable traits occur in Chinese indigenous and domesticated goats, such as extensive adaptability to stressful environments, outstanding disease and cold resistance, strong coarse fodder resistance, and high prolificacy. These traits are most likely multigenic and therefore represent a diverse natural gene pool. Interesting examples include the Jining gray goat (JNQ, associated with genes which determine the color of lambskin) and the Zhongwei goat (ZWS), the only fur-bearing goat in the world (associated with genes responsible for the unique fur phenotype). This genetic resource is invaluable for future goat breeding and utilization.
Recently, Chinese indigenous goat breeds have been threatened by the introduction of exotic goat breeds, which have typically been selected for optimal production of meat, wool, or other products. Because short-term profit maximization incentivizes the replacement or crossbreeding of Chinese indigenous goat breeds with more productive breeds, the indigenous gene pool is at risk. Both population size reduction and genetic variation dilution are major threats. There has been an increasing tendency to neglect the unique qualities and variety offered by indigenous breeds in favor of exotic breeds and their crosses. However, it is now recognized that it is important to establish conservation priorities and strategies to conserve genetic diversity within- and between-breeds, primarily to avoid further losses of genetic resources. Genetic diversity is one the most important factors that determines whether a breed survives and flourishes, or ultimately faces depression and extinction. The genetic diversity of domestic animals is crucial to meet current production needs in various environments, prospective and changing breeding objectives, and sustained genetic improvement. In response, various conservation strategies have been implemented. However, in order to make the best use of limited conservation funds, it is necessary to prioritize specific indigenous breeds for conservation [2].
Several conservation approaches have focused on breeds with maximum conservation value (i.e., breeds with high levels of genetic variation) [3,4]. The Weitzman approach, which has been widely employed to establish conservation priorities, uses between-breed genetic diversity to prioritize breeds that are highly distant from others based on genetic distance [4,5]. However, the Weitzman method has been criticized because it does not take within-breed diversity into consideration [5,6]. Other factors, including rare alleles that occur at anomalously high frequency due to inbreeding, strict genetic isolation, or founder effects, can compromise the effectiveness of the Weitzman method [7]. Another approach relies primarily on within-breed genetic diversity, which is usually calculated in terms of average expected heterozygosity (HE). The strategy prioritizes a breed if its removal from a population results in a maximum loss of global average HE. However, the drawback to this method is that it is insensitive to between-breed genetic diversity. Alternative methods that consider between- and within-breed diversity, based on co-ancestry or kinship, have been developed to prioritize breeds for conservation [8,9]. Although this approach ideally includes molecular and pedigree data, pedigree information is not available for many breeds, and thus in practice the method mainly depends on molecular data. To combine between- and within-breed diversity, various weights can be assigned to balance the two components [5,10–12] FST (Wright’s fixation index in total population) can be used to adjust the between-breed diversity derived from the Weitzman method, and 1-FST to adjust the within-breed diversity derived from the HE change in a metapopulation [5]. For example, Piyasatian and Kinghorn assigned between-breed components five times more weight than within-breed components [11]. Ginja et al [13] and Cañón et al [14] conducted conservation priority analyses for cattle using different methods. No one method has yet emerged as the best, but together they provide a comprehensive view of genetic diversity that can inform a conservation program.
Conservation priorities have been studied using the methods described above for domestic animals, including cattle [14], pig [10], sheep [15], chicken [16], horse [17], and goat. However, priorities for Chinese indigenous goat breeds have not been examined, except for one study in which the Weitzman approach was used to rank 12 mutton goat breeds [18]. In the work presented here, we conducted a comprehensive analysis of conservation priorities for 26 Chinese indigenous goat breeds, based on 30 microsatellite markers.
MATERIALS AND METHODS
Animal care
Protocols for blood and tissue sampling were approved by the Biological Studies Animal Care and Use Committee of the National Animal Husbandry Services, Beijing, People’s Republic of China. All experimental procedures followed guidelines established under the Law of Animal Husbandry in the People’s Republic of China (No. IASCAAS-AE-03,12 Dec 2016). The experimental procedure was approved by the Institutional Animal Care and Committee at National Animal Husbandry Service.
Sampling
In total, 1,351 samples from 26 representative Chinese indigenous goat breeds (Supplementary Figure S1) were used in this study. Goats from 19 provinces or autonomous regions in China were sampled, covering high altitude regions and plains. The blood samples were collected at major production centers meeting the characteristics and features of the breed, from healthy animals that were unrelated within three generations.
Thirty microsatellite markers recommended by the International Society for Animal Genetics (ISAG)/Food and Agriculture Organization of the United Nations (FAO) were used to genotype the 1,351 samples. The markers are CSRD247, ETH10, MAF209, OARAE54, SRCRSP15, SRCRSP3, SRCRSP5, TGLA53, DRBP1, ILSTS087, INRABERN172, MAF065, MCM 527, OARFCB20, SPS113, SRCRSP8, ILSTS029, INRA023, INRA063, INRABERN185, P19(DYA), SRCRSP23, SRCRSP9, TCRVB6, BM6444, ILSTS011, ILSTS005, SRCRSP7, OARFCB48, and MAF70. DNA was isolated from cryopreserved blood samples using the DNeasy Blood and Tissue Kit (Qiagen, Valencia, CA, USA). Polymerase chain reaction (PCR) amplifications were conducted using fluorescence-labelled primers. PCR products were analyzed by capillary gel electrophoresis using an ABI-PRISM 3130xl Genetic Analyzer (Applied Biosystems, Foster City, CA, USA) and LIZ 500 internal size standards (Applied Biosystems, USA). Data were collected and analyzed using GENEMAPPER 3.5 (Applied Biosystems, USA).
Genetic diversity analysis
Within-breed genetic diversity and marker polymorphism were estimated using GENALEX [19] and the Excel Microsatellites Toolkit to calculate the mean number of alleles (MNA), observed heterozygosities (HO) and HE. Allelic richness (Rt) over all loci for each breed was computed with FSTAT v 2.9.3.2 [20]. In this study, estimation of NE(0.05) were performed with linkage disequilibrium method and random mating model (minor allele frequency 0.05) using LDNe program [21].
The methods of conservation analyses used in this study have been demonstrated previously [13,14]. To better understand the statistical results, three approaches were employed: i) a method designed to minimize the overall kinship coefficient (Core Set method); ii) a method that considered between-breed diversity alone (Weitzman approach); iii) a method aimed at combining the within- and between-breed components of overall genetic diversity. These are described in detail below.
Core Set methods
The Core Set method [22] is based on measures of co-ancestry or kinship, and aims to eliminate the genetic overlap between populations in a core set. The coefficient of kinship was used as a measure of genetic similarity [22]. Negative contribution estimates were avoided through an iterative process that assigns the lowest value as zero, and recalculates contributions after a removal of the population. A coefficient matrix of kinships was estimated using three methods to correct for alleles identical: i) marker-estimated kinships (MEK), in which variation is based on weighted equal drift similarity (WEDS) [23]; ii) MEK estimation based on WEDS, using a bootstrap procedure (bootstrap 250); iii) a variation of the MEK method based on log linear regression obtained with a weighted log-linear model (WLM) [24]. Analyses of conservation priorities based on similarity matrices were performed using the FORTRNA application, which was developed and kindly shared by Eding and Meuwissen [22,24].
Pairwise kinship distances were computed from the MEK matrix following Eding et al [22]. Neighbor-net phylogenies for all breeds were constructed with kinship genetic distance using SPLITS TREE soft (version 4.12.6) [25]. Average molecular co-ancestries (fm), based on allele frequency, were analyzed using MOLKIN3 [26]. Genetic relationships were used to classify the goat breeds and generate contour plots of kinship coefficients (MEK based on WEDS and f
m) using the colorRamps package in R.
Within-breed contributions to diversity were computed using the average within-breed HE. The partial contribution made by individual breeds was computed as the proportional variation in average internal heterozygosity of the complete data set after removal of each breed (PCHe).
Weitzman approach
The Weitzman method was also used to calculate the partial contribution made by each breed to total genetic diversity (PCWeitz), based on Reynolds genetic distance (on diversity, Weitzman). This method estimates between-breed diversity and ignores within-breed diversity. Analyses conducted using the Weitzman method were computed using a FORTRAN program developed by Ollivier and Foulley [5]. Reynolds genetic distances were computed using MOLKIN3 software [26].
Combined methods
When making decisions about conservation priority, both within- and between-breed genetic diversity should be taken into account [5]. Three approaches were used to calculate the two components of global diversity for a metapopulation: i) Ollivier and Foulley [5] proposed that the aggregate diversity (PCFst) should weight the between-population diversity using the factor FST, and weight the within-population diversity using the factor 1-FST; ii) Piyasatian and Kinghorn proposed that the between-population diversity component should receive five times more weight than the within-population diversity (PC5:1) [11]; iii) Caballero and Toro [9] and Fabuel et al [10] assigned equal weights to the within-population co-ancestries and genetic distances. In this case, calculations were performed using MOLIKN3 [26]. Pairwise correlation analysis was performed using the PICANTE package of R with the Pearson method.
RESULTS AND DISCUSSION
Marker polymorphisms, within-breed diversity and breed relationships
Summary statistics describing microsatellite marker polymorphisms and genetic diversity per breed are presented in Table 1 and Supplementary Table S1, respectively. A total of 430 alleles were observed in 26 Chinese indigenous goat populations, with locus BM6444 showing the largest observed (NA, 12.385±0.60) and effective (NE, 6.202±0.299) allele number (Supplementary Table S1). In contrast, the smallest values for NA and NE were 2.308±0.092 and 1.393±0.06 at locus MAF209. The mean HO for all loci is 0.577±0.008, ranging from 0.269± 0.041 at locus MAF209 to 0.785±0.031 at locus OARFCB48. The mean HE is 0.638±0.006, ranging from 0.25±0.03 at locus MAF209 to 0.827±0.01 at locus BM6444. The FST value across the 30 loci has a relatively high mean (0.141±0.010), indicating that there is genetic differentiation among the 26 Chinese indigenous goat populations. There are 23 loci exhibit positive FIS values, and the positive mean FIS is 0.082±0.029. This may indicate non-random mating, and these loci may be morphological or productive traits under selection.
The MNA was relatively high in the 26 Chinese indigenous goat populations, of which the largest was in the Xinjiang goat (XJS, 8.23±2.93), and the lowest in the Daiyun goat (DYS, 4.40±2.25) (Table 1). However, the highest and lowest values for the effective number of alleles were 4.369±0.299 in the JNQ and 2.424±0.217 in the DYS. The mean Rt was 5.61± 2.04, ranging from 7.03±2.27 in the XJS to 3.89±1.91 in the DYS. Additionally, higher estimates of expected and HO were observed in the JNQ (HE, 0.737±0.024; HO, 0.646±0.012), whereas the values of HE and HO were 0.507±0.039 and 0.434± 0.013 in the DYS, representing the smallest heterozygosity (Table 1). All populations in which HE exceeded HO yield positive values for FIS.
The level of allelic diversity in this study was similar to that reported for 9 Chinese cashmere goats [27], but lower than in the Chinese Cashmere [28] and Swiss [29] goat populations. The heterozygosity of most of the breeds examined in this study was also lower than the values reported in these studies, particular the HO. Loss of genetic diversity among populations can be caused by genetic introgression [30], environmental change [31] and inbreeding. In our study, FIS had a positive value in all breeds, demonstrating a deficit of heterozygosity (Table 1). FIS is usually used to obtain a deeper understanding of the degree of endangerment and inbreeding, and is also considered as a criterion for conservation priority. In present study, 5 breeds had FIS values less than 0.05; 16 breeds fell into the range 0.05 to 0.15, and 5 breeds in the range 0.15 to 0.25. These levels are higher than previously reported in Chinese cashmere goats [27]. Effective population size (NE) is also a valuable indictor for evaluating conservation priorities. Effective population size (NE0.05) were computed based on linkage disequilibrium with minor allele frequency 0.05 (Table 1). NE0.05 ranged from 32.7 DYS up to 569.7 ZWS. According to Franklin’s 50/500 rule of thumb [32], effective population size under 50 suggested that population is facing to serious genetic threaten. Small population are easy to inbreeding depression. The lowest population size of DYS means that it is necessary to implement conservation program. According to allele statistics, lower allele richness, HO, HE, NEA, MNA, and FIS of Daiyun indicated a relatively high inbreeding. The reasons behind is human intervention of mating process which influencing by introduction of breeds with high performance and intensive breeding. So, DYS and Shannan White goat (SNB) (NE0.05 = 47.5) should be paid more attention and considered in conservation program.
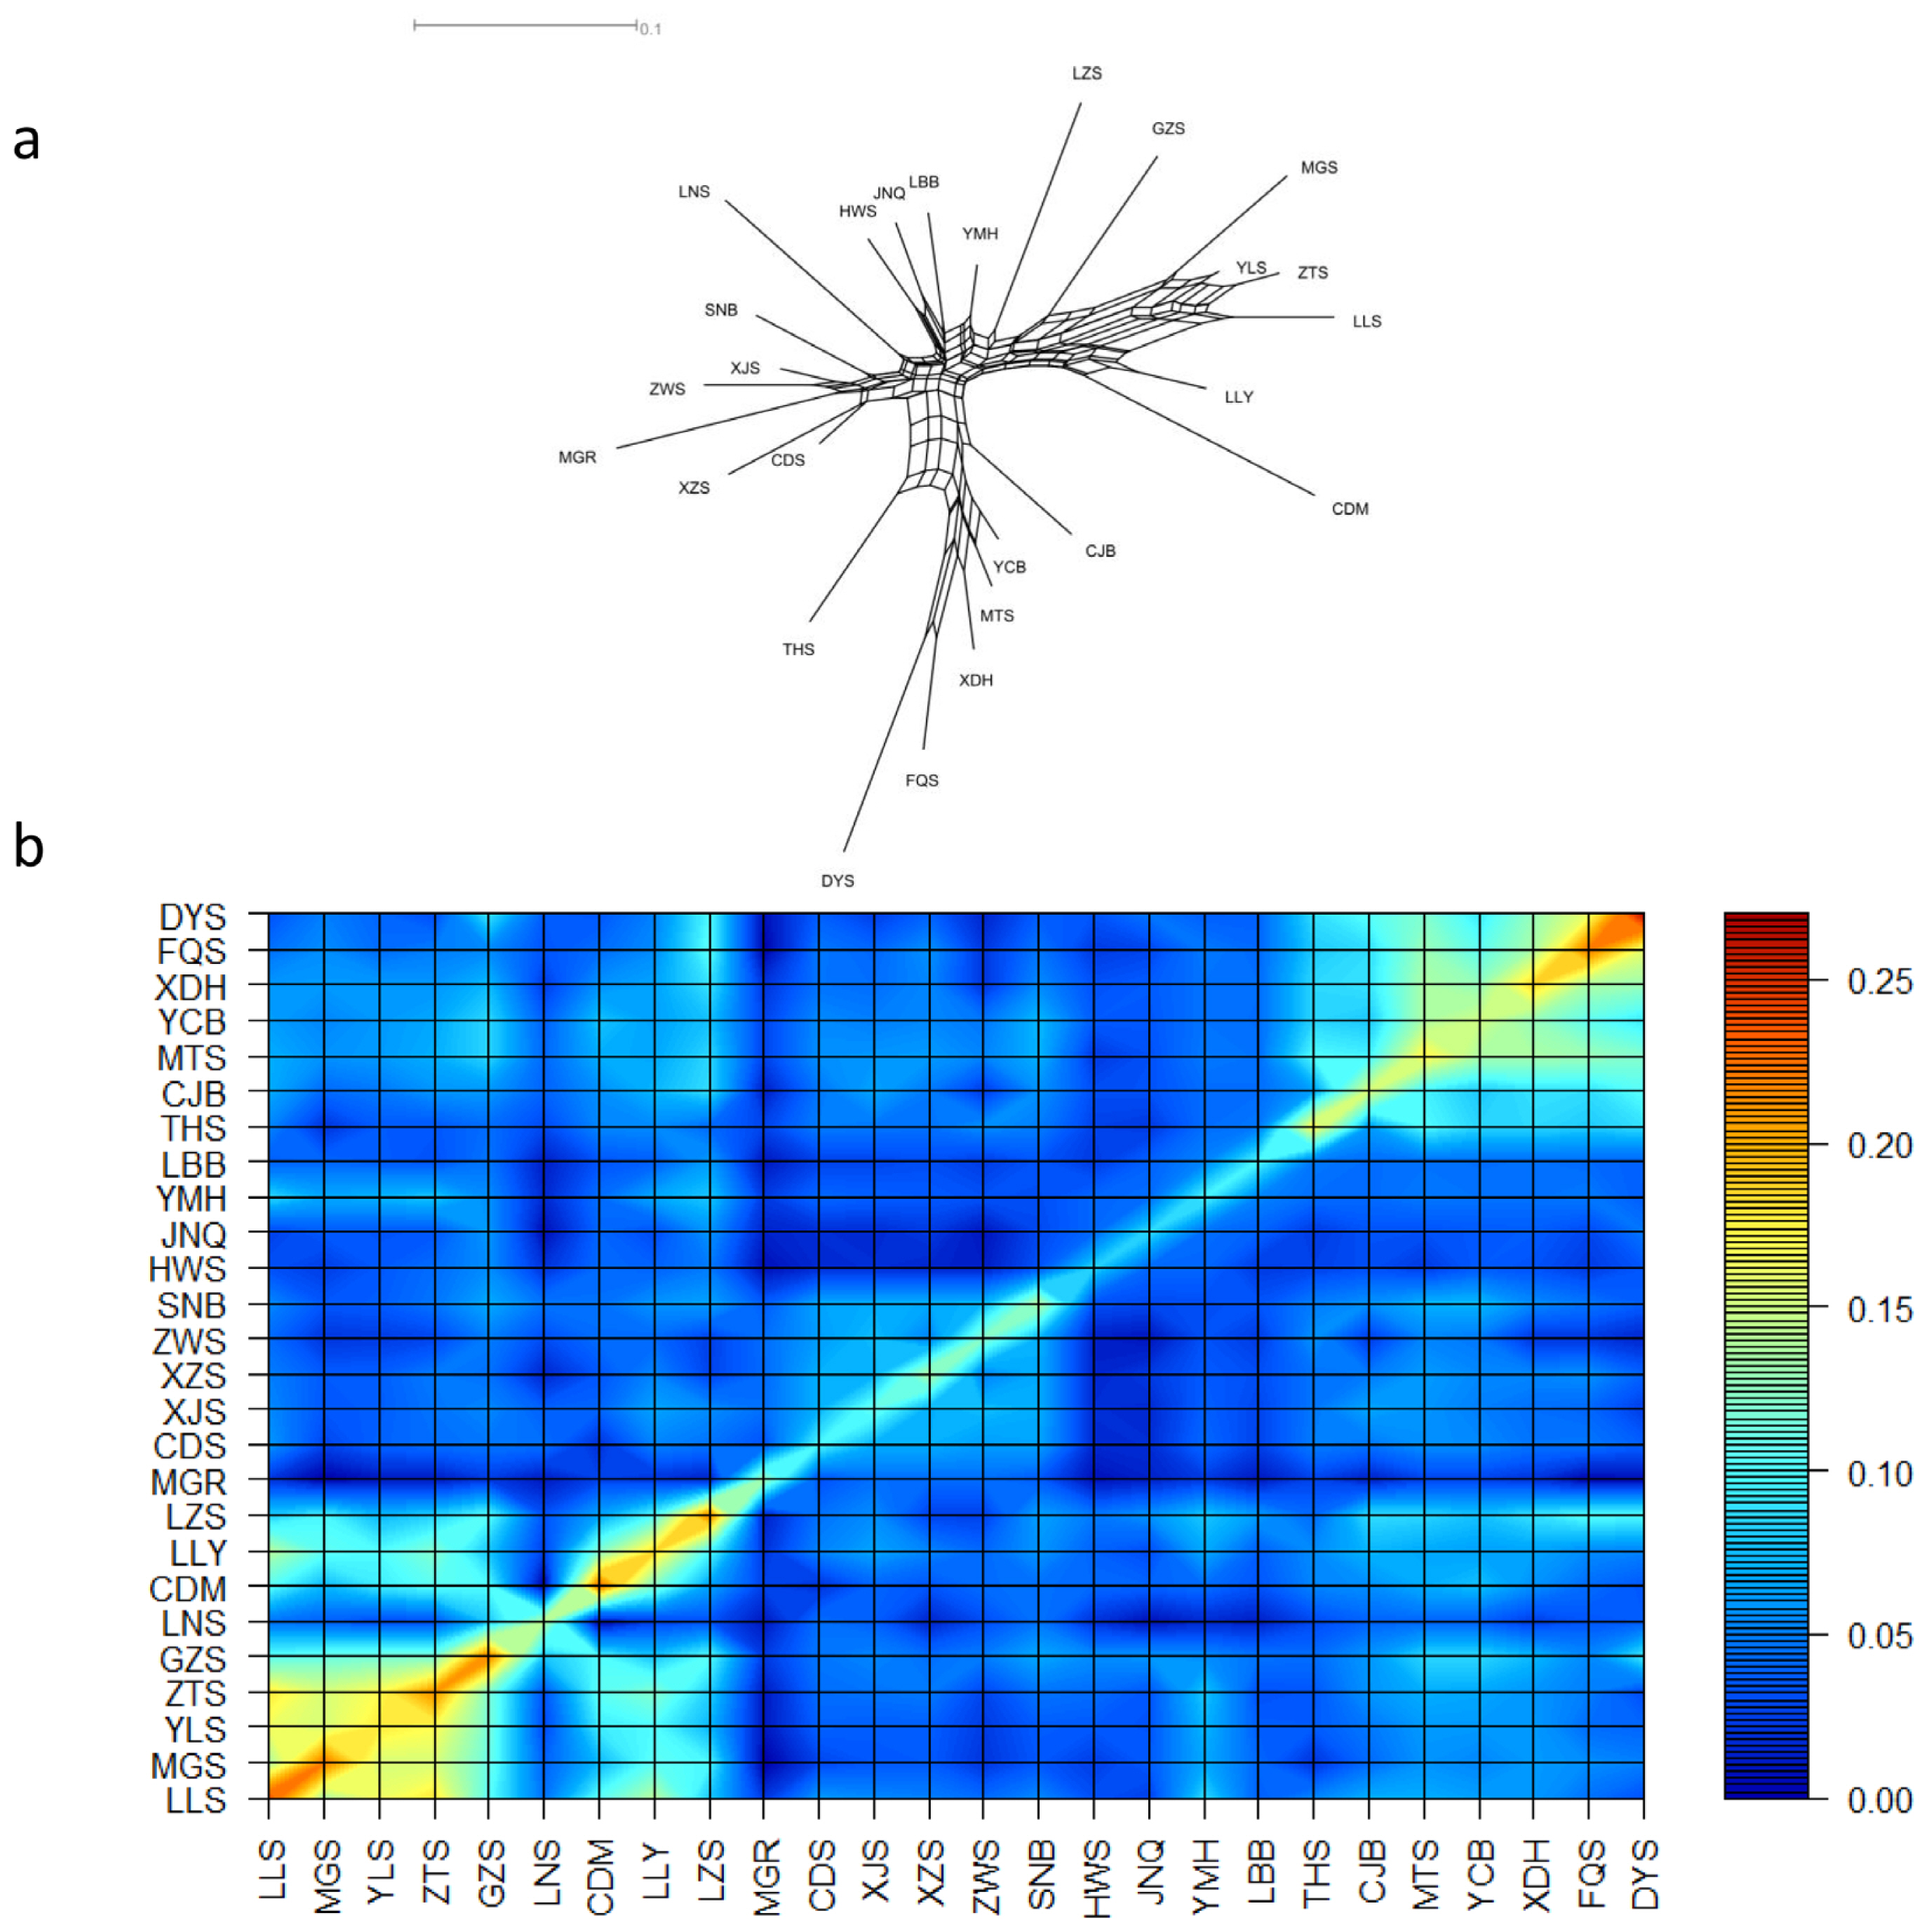
The neighbor-net phylogeny of kinship distances shows the relationships among the 26 Chinese indigenous populations (Figure 1a). The phylogeny of kinship distances was similar to that generated using the Reynolds distance (Supplementary Figure S2a). Goats from northern China, such as the Inner Mongolia Cashmere goat (MGR), Tibetan goat, ZWS, XJS, Chaidamu goat (CDS), and SNB clustered together, and were close to the Huanghuai goat (HWS) and JNQ. Except for the Shannan white goat, these breeds belong to the North China cluster [32]. The DYS, Fuqing goat (FQS), and Xiangdong Black goat (XDH) clustered together with a long branch length, like Longlin goat (LLY) and Chengdu Brown goat (CDM) on one side, with Longling yellow goat (LLS), Zhaotong goat (ZTS), Yuling goat (YLS), and Maguan poll goat (MGS) on the other side. The Matou goat (MTS) and Yichang White goat (YCB) clustered together, partly consistent with a previous study by Wang et al [33] that placed MTS, YCB, and SNB into the Central China cluster. Although Wang et al [33] also proposed that LLS, MGS, YLS, ZTS, CDM, and LLY belonged to the Southwest China cluster, our results cluster LLY and CDM within a separate branch. The discrepancy may reflect the fact that more loci were used in the present study, supporting a more accurate analysis. The majority of goat populations cluster in agreement with their geographical origin.
Within-breed diversity could also be estimated using kinship coefficients with either the MEK derived from genotypes or the average coancestries (f
m) obtained from allele frequencies. To aid in the analysis, contour plots were plotted to visualize both within- and between-breed kinships. Each population was sorted based on its genetic proximity defined in the phylogenetic neighbor-net graph (Figure 1b; Supplementary Figure S2b). The area shaded from brown to red represents highly inbred breeds: the DYS (MEK = 0.267 and f
m = 0.499), LLS (MEK = 0.242 and f
m = 0.417), CDM (MEK = 0.229 and f
m = 0.400), MGS (MEK= 0.223 and f
m = 0.408), Guizhou White goat (MEK = 0.222 and f
m = 0.424), Leizhou goat (LZS, MEK = 0.222 and f
m = 0.423), and the FQS (MEK = 0.221 and f
m = 0.436). The yellow shading represents goat breeds with intermediate kinship values: the XDH (MEK = 0.186 and f
m = 0.398), LLY (MEK = 0.185 and f
m = 0.368), YLS (MEK = 0.178 and f
m = 0.378), MTS (MEK = 0.174 and f
m = 0.381), Taihang goat (THS, MEK = 0.173 and f
m = 0.349), and the Yangtse River Delta White goat (CJB, MEK = 0.154 and f
m = 0.364). The light blue and light yellow areas also reveal goat breeds with relationships. The two groupings consist of the LLS, MGS, YLS, and ZTS (0.136<MEK<0.179, 0.348<f
m<0.380), and the DYS, FQS, XDH, YCB, and MTS (0.092<MEK<0.160, 0.328< f
m<0.407).
Analyses of conservation priorities for Chinese indigenous goat
Based on different approaches, analyses of conservation priorities for Chinese indigenous goat populations is presented in Tables 2 and 3. Fourteen (out of 26) populations were estimated to make a null contribution to total genetic diversity, based on the Bootstrap, WEDS, and WLM kinship methods (Table 2). The three highly prioritized breeds were the JNQ, Liaoning Cashmere goat (LNS), and MGR (0.1361<WEDS< 0.1622, 0.1324<Bootstrap<0.1613 and 0.1071<WLM<0.2621). A similar ranking of conservation priority was obtained using all three methods. This may indicate that high within-breed genetic diversity exists in these populations.
A considerable number of populations with negative value for PCHe (14 breeds) were observed, based on the proportional contribution of each breed to the average HE for the whole population (Table 2). For these populations, there is a gain in total diversity after they are excluded. As expected, the majority of these breeds have highly inbred status (high within-breed kinship coefficients) and relatively low heterozygosity (low HE) (Figure 1b; Table 1). The XDH, DYS, FQS, and MTS have the most negative PCHe values (−0.218<PCHe<−0.195) (Table 2). The most important conservation priorities, ranked high to low, are the JNQ, MGR and LNS (0.258<PCHe<0.363) based on PCHe value (Table 2). Breeds with intermediate PCHe values include the Tibet goat, HWS, Lubei White goat (LBB) and CDS (0.173<PCHe<0.227) (Table 2).
The conservation priorities assigned using the Weitzman approach depend mainly on between-breed diversity, and therefore favor highly differentiated breeds that have large genetic distances from other breeds. The breeds making the most contribution to global diversity were the MGR, LZS, and CDM (6.57<PCWeitz<7). The HWS, Tibet goat, LBB and YCB (4.14<PCWeitz<5.6) made intermediate contributions to total diversity. The smallest contributions were made by the YLS, THS, and ZTS (1.58<PCWeitz<1.96) (Table 2).
Ollivier and Foulley [5] proposed that both within- and between-breed components should be taken into consideration (PCFst) [5]. In this approach, the FST value of the whole populations is used to weight PCWeitz (FST = 0.138 in this study) and 1-FST is used to weight PCHe. The PCFst method prioritizes breeds by kinship (i.e., the HWS with PCFst = 0.969 and WEDS = 0.2017), and also prioritizes breeds that contribute highly to PCWeitz (i.e., the CDM with PCFst = 1.034 and PCWeitz = 6.71). The breed with the highest priority is the MGR (PCFst = 1.235, WEDS = 0.1622, WLM = 0.1071, PCHe = 0.307 and PCWeitz = 7). Although the Tibet goat makes an intermediate contribution to total diversity as estimated by various methods (WEDS, WLM, PCHe, and PCWeitz), it also has a relatively high PCFst value (PCFst = 0.951). However, the ranking derived from the PC5:1 method (as proposed by Piyasatian and Kinghorn) is similar to the priority estimated using PCWeitz, because it prioritizes the CDM, MGR, and LZS, due to the increased weight given to the between-breed component.
The results obtained from the combined approach proposed by Caballero and Toro [9] and Fabuel et al [10] are shown in Table 3. The breeds making the highest contributions to global coancestry were the FQS, MTS, and LZS this is the result of high within-breed coancestry (0.423<f
ii<0.499) and the relatively low distance from all the other populations (0.095<Dnei< 0.120). Although the DYS has a relatively high f
ii value (0.499), its mean genetic distance was also larger (Dnei = 0.147) and thus its contribution to f was relatively low (0.0119). The difference between f
ii and Dnei is responsible for calculating the contribution to global co-ancestry. The absolute contribution to total diversity prioritized the JNQ (0.0356), CD (0.0343) and Xijiang goat (0.0335). Ranking by absolute contribution yielded results similar to assigning priority based on proportional contributions to genetic diversity. Using absolute contributions, priority was assigned to the JNQ (4.808), CDS (4.632), and XJS (4.524). The ZWS has the lowest contribution (1.931), perhaps due to its relatively low sample size (n = 25). When the proportional contribution to genetic diversity was estimated without reference to sample size, only the JNQ (4.240) and CDS (4.078) maintain their higher priorities. The Tibet goat also obtained a high priority (4.051). In contrast, the DYS made the smallest contribution (PC1 = 3.052 and PC2 = 3.362). Finally, total genetic diversity was analyzed after removing one subpopulation at a time from the total population. Removal of the JNQ resulted in the largest reduction in total genetic diversity (GDT|i = 0.7378, loss/gain = −0.4%), followed by the MGR (GDT|i = 0.7382, loss/gain = −0.3%) and LNS (GDT|i = 0.7386, loss/gain = −0.3%).
Linear correlation coefficients calculated for pairwise contributions derived from different methods are shown in Table 4. No negative correlation occurs between any pairwise contributions, even between Weitzman and HE contributions (0.321). The correlations between PC5:1 and other methods are similar to the correlation between PCWeitz and others because of the excess weight given to between-breed components in PC5:1. Compared to PCweighted, higher correlations were observed between PCunweighted and other methods. As there are too many null contributions in the three core set methods, it is not useful to calculate the correlation between these and the other methods, despite the higher correlation between core set methods and PCHe.
CONCLUSION
In conclusion, this study analyzed the extant genetic diversity of Chinese indigenous goats in terms of within- and between-breed components. Various approaches utilizing these factors were compared to evaluate their utility and shortcomings in a conservation program. Our results suggest MGR (most methods), JNQ and LNS (high contribution to heterozygosity and total diversity) should be prioritized based on above results. Furthermore, DYS and SNB also should be prioritized based on consideration of effective population size. However, if one breed could survive in changing conditions all the time, the straightforward approach is to increase its utilization and attraction for production via mining breed germplasm characteristic.
 PDF Links
 PubReader
 ePub Link
 Full text via DOI
 Full text via PMC
 Download Citation
 Supplement
 Print
Print


