 |
 |
Abstract
The accumulation of inbreeding and the loss of genetic diversity is a potential problem in the modern swine breeds in China. Therefore, the purpose of this study was to analyze the pedigrees of Chinese Duroc (CD), Landrace (CL) and Yorkshire (CY) swine to estimate the past and current rates of inbreeding, and to identify the main causes of genetic diversity loss. Pedigree files from CD, CL and CY containing, 4529, 16,776 and 22,600 records, respectively, were analyzed. Pedigree completeness indexes of the three breeds, accounting for one generation back, were 83.72, 93.93 and 93.59%, respectively. The estimated average annual inbreeding rates for CD, CL and CY in recent three years were 0.21, 0.19 and 0.13%, respectively. The estimated average percentage of genetic diversity loss within each breed in recent three years was about 8.92, 2.19, and 3.36%, respectively. The average relative proportion of genetic diversity loss due to unequal contributions of founders in CD, CL and CY was 69.09, 57.95 and 60.57%, and due to random genetic drift was 30.91, 42.05 and 39.43%, respectively. The estimated current effective population size for CD, CL and CY was 76, 117 and 202, respectively. Therefore, CD has been found to have lost considerable genetic diversity, demanding priority for optimizing the selection and mating to control future coancestry and inbreeding. Unequal contribution of founders was a major cause of genetic diversity loss in Chinese swine breeds and random genetic drift also showed substantial impact on the loss of diversity.
Genetic Diversity, the level of biodiversity, refers to the total number of genetic characteristics in the genetic makeup of a species. Genetic diversity in livestock species can be divided into within-breed and between breed genetic diversity. This study will focus on within breed genetic diversity of swine because it directly affects the genetic improvement of swine populations. The future genetic progress of swine breeds will depend mainly on the availability of sufficient genetic variation, which has tremendous benefits to the swine industry. Genetic diversity of a breed is demanded to meet current and future production requirements in different environments, to allow sustained economically important genetic improvement, and to be convenient for adapting rapidly the breeding objectives (Melka and Schenkel, 2010).
However, a considerable amount of genetic diversity is thought to have already been lost in swine breeds. Over the past 50 yr, because of rapid changes in production systems, market forces, high strength artificial selection and indiscriminate crossing with exotic breeds, animal genetic resources available throughout the world have declined dramatically (FAO, 2000; 2007; Barker, 2001). Several authors have reported loss of diversity in swine breeds. For example, Melka and Schenkel (2010) reported the Canadian Hampshire had a 22% high loss of genetic diversity, and suggested a need for more immediate conservation. Vicente et al. (2008) showed that the level of inbreeding was a major factor of diversity loss in native Portuguese swine breeds. Alves et al. (2008) and Fernandes et al. (2010) also had similar reports on Iberian and B├Łsaro pigs, respectively. The loss of genetic diversity is associated with various unfavorable incidents, such as inbreeding depression in fitness-related traits, the fixation of favorable alleles and an increased fluctuation in selection response (Falconer and Mackay, 1996). In a small closed population, inbreeding increases at a higher rate, leading to loss of alleles, which is impossible to counterbalance without migration (Wooliams, 2007). Even with no selection, alleles present in one generation may, by chance, become more or less frequent, or even disappear, in subsequent generations due to genetic drift, but only mutation or immigration can restore lost variants (Lacy, 1989).
Sichuan province has the largest populations and the longest history of imported pigs (such as Yorkshire, Landrace and Duroc) in China. The official breeding program of imported swine breeds in Sichuan Province began at 1995. After that, several continuous breeding projects were implemented in Sichuan province and the selected population of imported pig breeds increased rapidly with many excellent breeding pigs being introduced from other countries and regions (e.g., Denmark, Canada, American, Taiwan, etc.). Pedigree and trait information related to the breeding were collected in past decade. However, to date, no breed-wide analysis for the accumulation of inbreeding and genetic diversity loss has been performed in the imported swine population of Sichuan province.
Evaluating the inbreeding and loss of genetic diversity within a breed is a requisite for sustainable improvement in the long term. Fortunately, many breeds have pedigree information, moreover, pedigree information has already been used in monitoring and evaluating genetic diversity of breeds based on the effective population size and the probabilities of gene origin (e.g., S├Ėrensen et al., 2005; Melka and Schenkel, 2010; Stachowicz et al., 2010; Welsh et al., 2010). The objective of this study was to perform an in-depth analysis of the most recently updated pedigrees of Chinese Duroc, Landrace and Yorkshire breeds in the united breeding network of Sichuan province to assess the rates of inbreeding and genetic diversity, and to determine the main causes of diversity loss.
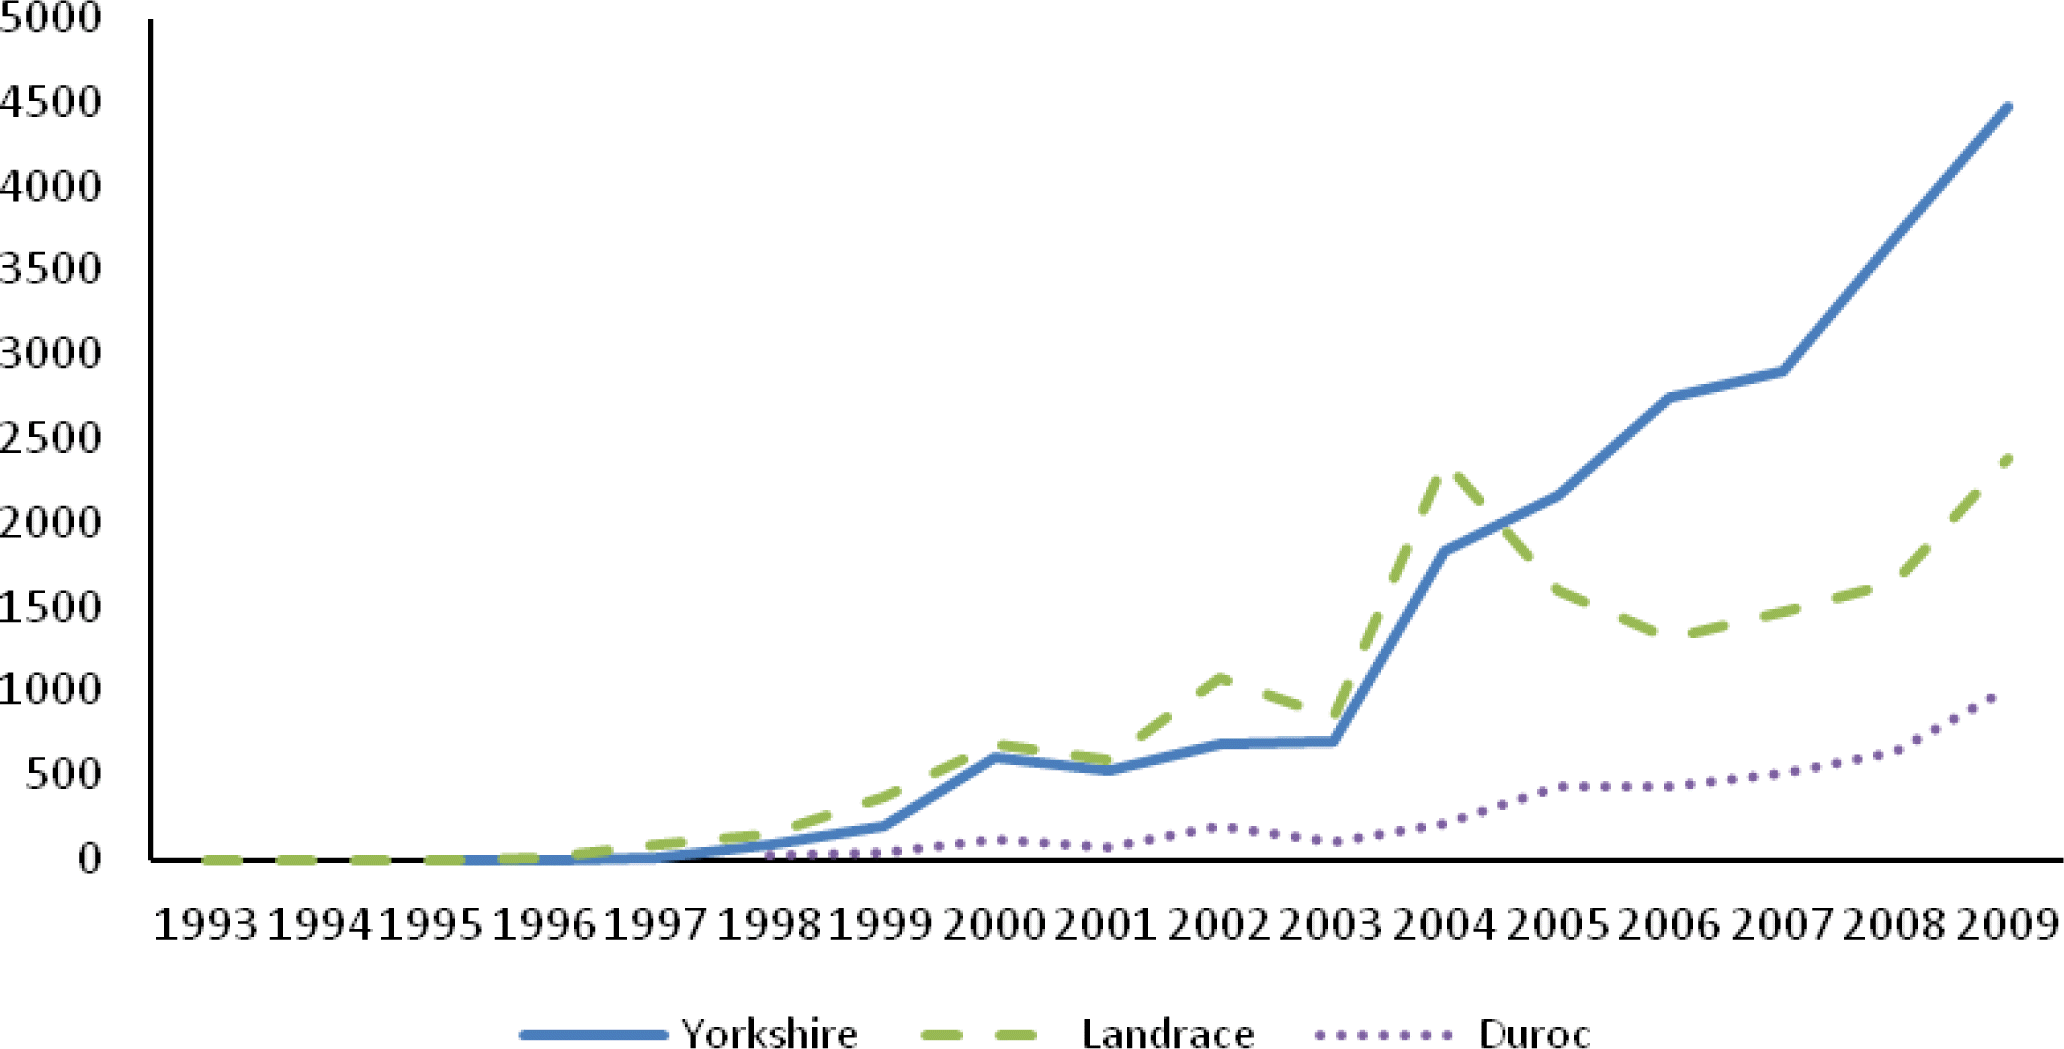
The pedigree records (Table 1) of 4,529 Chinese Duroc (CD) pigs born from 1998 to 2009, 16,776 Chinese Landrace (CL) pigs born from 1993 to 2009, and 22,600 Chinese Yorkshire (CY) pigs born between 1993 and 2009 were provided by Sichuan Province Livestock Improvement Station (Chengdu, Sichuan, China). For each breed, a reference population was defined as piglets born from year 2008 to 2009 (two yrs) because the average generation interval for each breed was close to 2 yr (Duroc: 1.79 yr; Landrace: 1.87 yr; Yorkshire: 1.78 yr) and, hence, it comprises the last generation of data evaluated in each breed. The population size of Duroc was the smallest in three breeds because it is mainly used as the terminal paternal line in crossbreeding production system of Duroc├ŚLandrace├ŚYorkshire (DLY), and the market demand for it is less in China. The parameters were calculated in the reference population for each breed (Table 1). Data used in this study came from eight commercial pig farms (DYZC, DZZC, JYZC, LESH, MYZC, NANC, NJPF, and SCBF, which are members of united breeding program of Sichuan province). The official breeding program in Sichuan province was begun in 1995, however, the size of population selected at that time was very small. The year 1999 was used as a first year where a continuous, formal performance testing scheme with significance size (>500) was implemented based on the project ŌĆ£United-Breeding of Foreign Pigs in SichuanŌĆØ. The numbers of animals in each birth year cohort are shown in Figure 1.
The completeness and depth of pedigree affects the estimated inbreeding coefficients and relationships among animals directly, and which also affects the estimated generation intervals and effective numbers of founders and ancestors to a certain extent (Stachowicz et al., 2010). Five different measures were used to assess the completeness of the pedigree: mean maximum generations, mean complete generations, mean equivalent generations, the percentage of known ancestors per generation, and pedigree completeness index (Melka and Schenkel, 2010; Stachowicz et al., 2010). The number of generations between an animal and its earliest ancestor was taken as the maximum generations number traced back, and mean maximum generations was the average maximum generations numbers traced back for all individuals in a pedigree. The pedigree completeness index (PCI), described by MacCluer et al. (1983), was calculated for all individuals for 1, 3, 5, and 7 generations back in the pedigree:
where, Csire and Cdam are the indexes for paternal and maternal contribution, respectively, and
where, ai is the percentage of ancestors known in generation i and d is a preset number of generations traced back in pedigree.
The inbreeding coefficient is defined as a probability for two alleles to be identical by descent (Falconer and Mackay, 1996). In this study, a modified algorithm described by Sargolzaei at al. (2005) was used to compute the inbreeding coefficient:
where Fi is the inbreeding coefficient of individual i, aii is the additive genetic relationship between individual i and itself.
The coefficient of coancestry, half of additive genetic relationship, was used to predict future rates of inbreeding because the coefficient of coancestry of parents equals the inbreeding coefficient of progeny (Falconer and Mackay, 1996). It was also, jointly with the inbreeding coefficient, used to evaluate the degree of nonrandom mating, and calculated below:
where fxy and axy are the coancestry coefficient and additive genetic relationship between individual x and y, respectively.
A ŌĆśrealizedŌĆÖ effective population size (Ne) from individual increase in inbreeding (Guti├®rrez et al., 2008) using the extension proposed by Guti├®rrez et al. (2009) was calculated as:
where
Δ F ¯
The effective number of founders (or founder equivalent, fe) is a measure of founder contributions to the population and is defined as the number of founders with equal contribution, which would give the same amount of genetic diversity that is present in the current population. The fe was calculated based on the method described by Lacy (1989) using the formula below:
where qi is the genetic contribution of the ith founder to the reference population and f is the total number of founders. It is usually much smaller than the actual number of founders in pedigree (animals with both parents unknown). This reflects the unequal contribution of founders to the current population due to selection rates (probability of becoming a parent and variation of family size).
In a practical population with limited size, the loss of genetic diversity would occur because of genetic drift, even if founders would contribute equally to this population (Lacy, 1989). The effective number of founder genomes (or founder genome equivalent, fge), therefore, is defined as the number of equally contributing founders with no loss of founder alleles that would give the same amount of genetic diversity as is presented in the reference population. The fge was calculated using the method proposed by Caballero and Toro (2000), and calculated as:
where f╠ģg is the average coancestry for the group considered.
The effective number of nonfounders (or nonfounder equivalent, nfe) was calculated as:
where, nfe accounts for the contributions of nonfounders and, therefore, for loss of genetic diversity due to drift accumulated over nonfounder generations (Caballero and Toro, 2000).
Measures of the loss of genetic diversity can be derived from fe, fge, and nfe. The amount of genetic diversity (GD) in the reference population accounting for loss of diversity due to genetic drift and unequal founder contribution was calculated as (Lacy, 1995):
when expressed as 1-GD, it measures the genetic diversity lost in the population due to bottlenecks and genetic drift since the founder generation. It is assumed that the number of founders in the base population is large enough so that GD in the base population is close to 1 (Melka and Schenkel, 2010).
The amount of genetic diversity in the reference population considering for loss of diversity due to unequal founder contribution (GD*) was calculated as (Lacy, 1995):
The difference between GD* and GD is:
and it measures the loss of diversity by genetic drift accumulated over nonfounder generations (Caballero and Toro, 2000; Honda et al., 2004).
The parameters in genetic diversity in the Chinese Duroc, Landrace and Yorkshire breeds were computed using four software packages. The effective number of founders, founder genomes and non-founders were calculated using CFC (Sargolzaei et al., 2006); percentages of known ancestors in each generation, the proportion of gene pool explained by certain number of ancestors, and cumulated marginal contributions of ancestors were obtained using PEDIG (Boichard, 2002). The software package EVA (Berg, 2003) was used to obtain average inbreeding, average coancestry, expected inbreeding under random mating, degree of nonrandom mating, and pedigree completeness indices. The effective population size and generation interval were computed using ENDOG program (Guti├®rrez and Goyache, 2005).
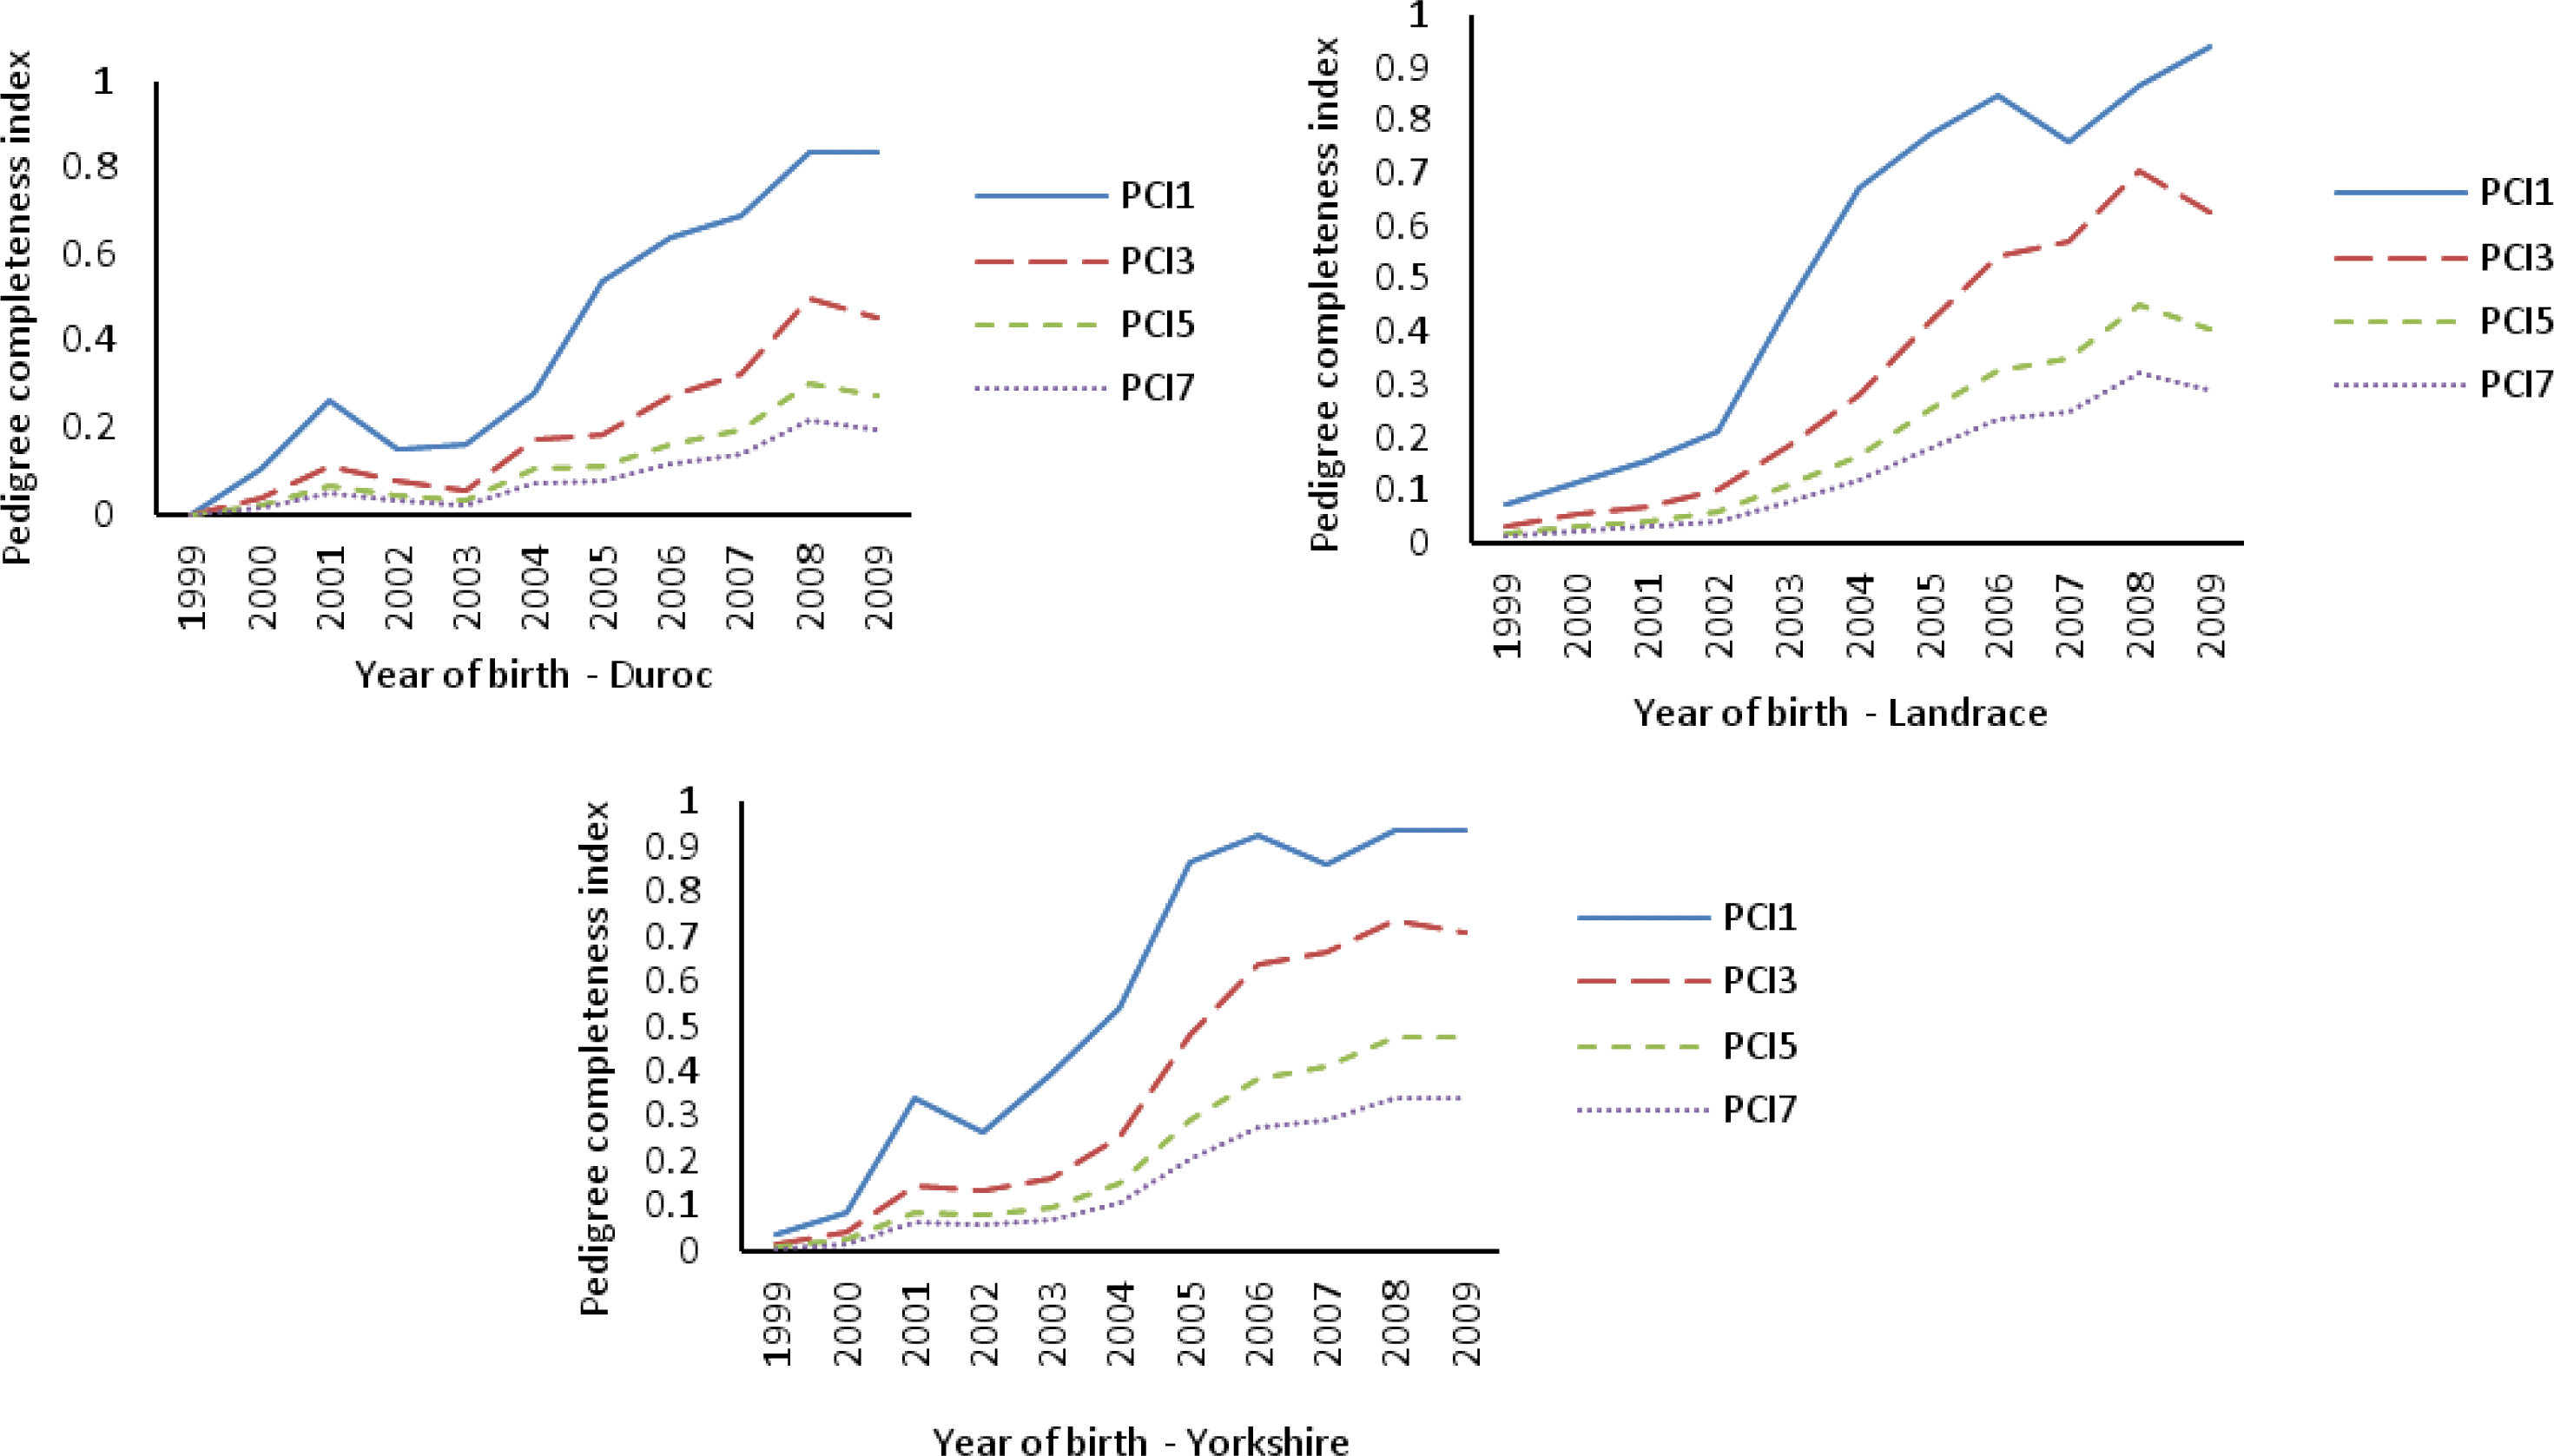
In the Chinese Duroc (CD), Landrace (CL) and Yorkshire (CY) pedigrees, the percentages of animals with both parents known were 86.05, 87.40 and 91.49%, respectively, since the beginning of the 1999 for all animals. Table 1 lists some parameters for the whole pedigree and reference population. The maximal ancestral path traced back in the pedigree for three Chinese breeds were 7, 7, and 6, respectively. The mean maximal generations, mean complete generations and mean equivalent generations in CD were the least (2.08, 1.59 and 1.82, respectively) in three Chinese breeds, followed in CL (2.46, 1.85 and 2.11), while the highest in CY (3.06, 2.32 and 2.65, respectively). Almost all ancestors were known in each breed in the first generation. Investigating the depth of pedigree, CY and CD had the highest (23.78%) and lowest (1.42%) percentage of ancestors known in fifth generation. Figure 2 shows the average PCI by year of birth, accounting for 1, 3, 5 and 7 generations for all animals. The PCI of CD and CY was over 90% since 2005 in 1 generation back, while in 7 generations back, it was under 30% for the two breeds. The PCI of CD was over 80% in recent two years when considering 1 generation back.
Effective population size (Ne) and generation interval for three Chinese swine breeds are listed in Table 2. The Ne of CD, CL and CY in the reference population were 76, 117 and 202, respectively. The percentage of inbred animals in the reference population for three Chinese swine breeds were 29.24, 34.98 and 22.92%, respectively. The longest and the shortest generation interval were observed in CL (1.87 yr) and CY (1.78 yr). The generation interval of females was larger than males, and slightly larger than the same breeds in other countries (such as the paper described by Melka and Schenkel, 2010) because the lifespan of boars and sows were longer in China.
Some parameters derived from the analysis of probability of gene origin in the reference population (2008 to 2009) are listed in Table 3. The lowest total number of founders was observed in CD (295), followed by CL (731), and the highest was CY (958). However, oppositely, the fewest effective number of founder genomes was observed in CY (41.85), followed by CL (46.78), and the most was in CD (49.13). The fe/f ratio in CD was larger than in CY and CL. This might mean that the selection intensities of interesting traits (such as days to 100 kg, backfat to 100 kg, litter size, etc.) in CY and CL were higher than in CD. The fge/fe ratios of CD, CL and CY were 0.56, 0.32 and 0.31, respectively.
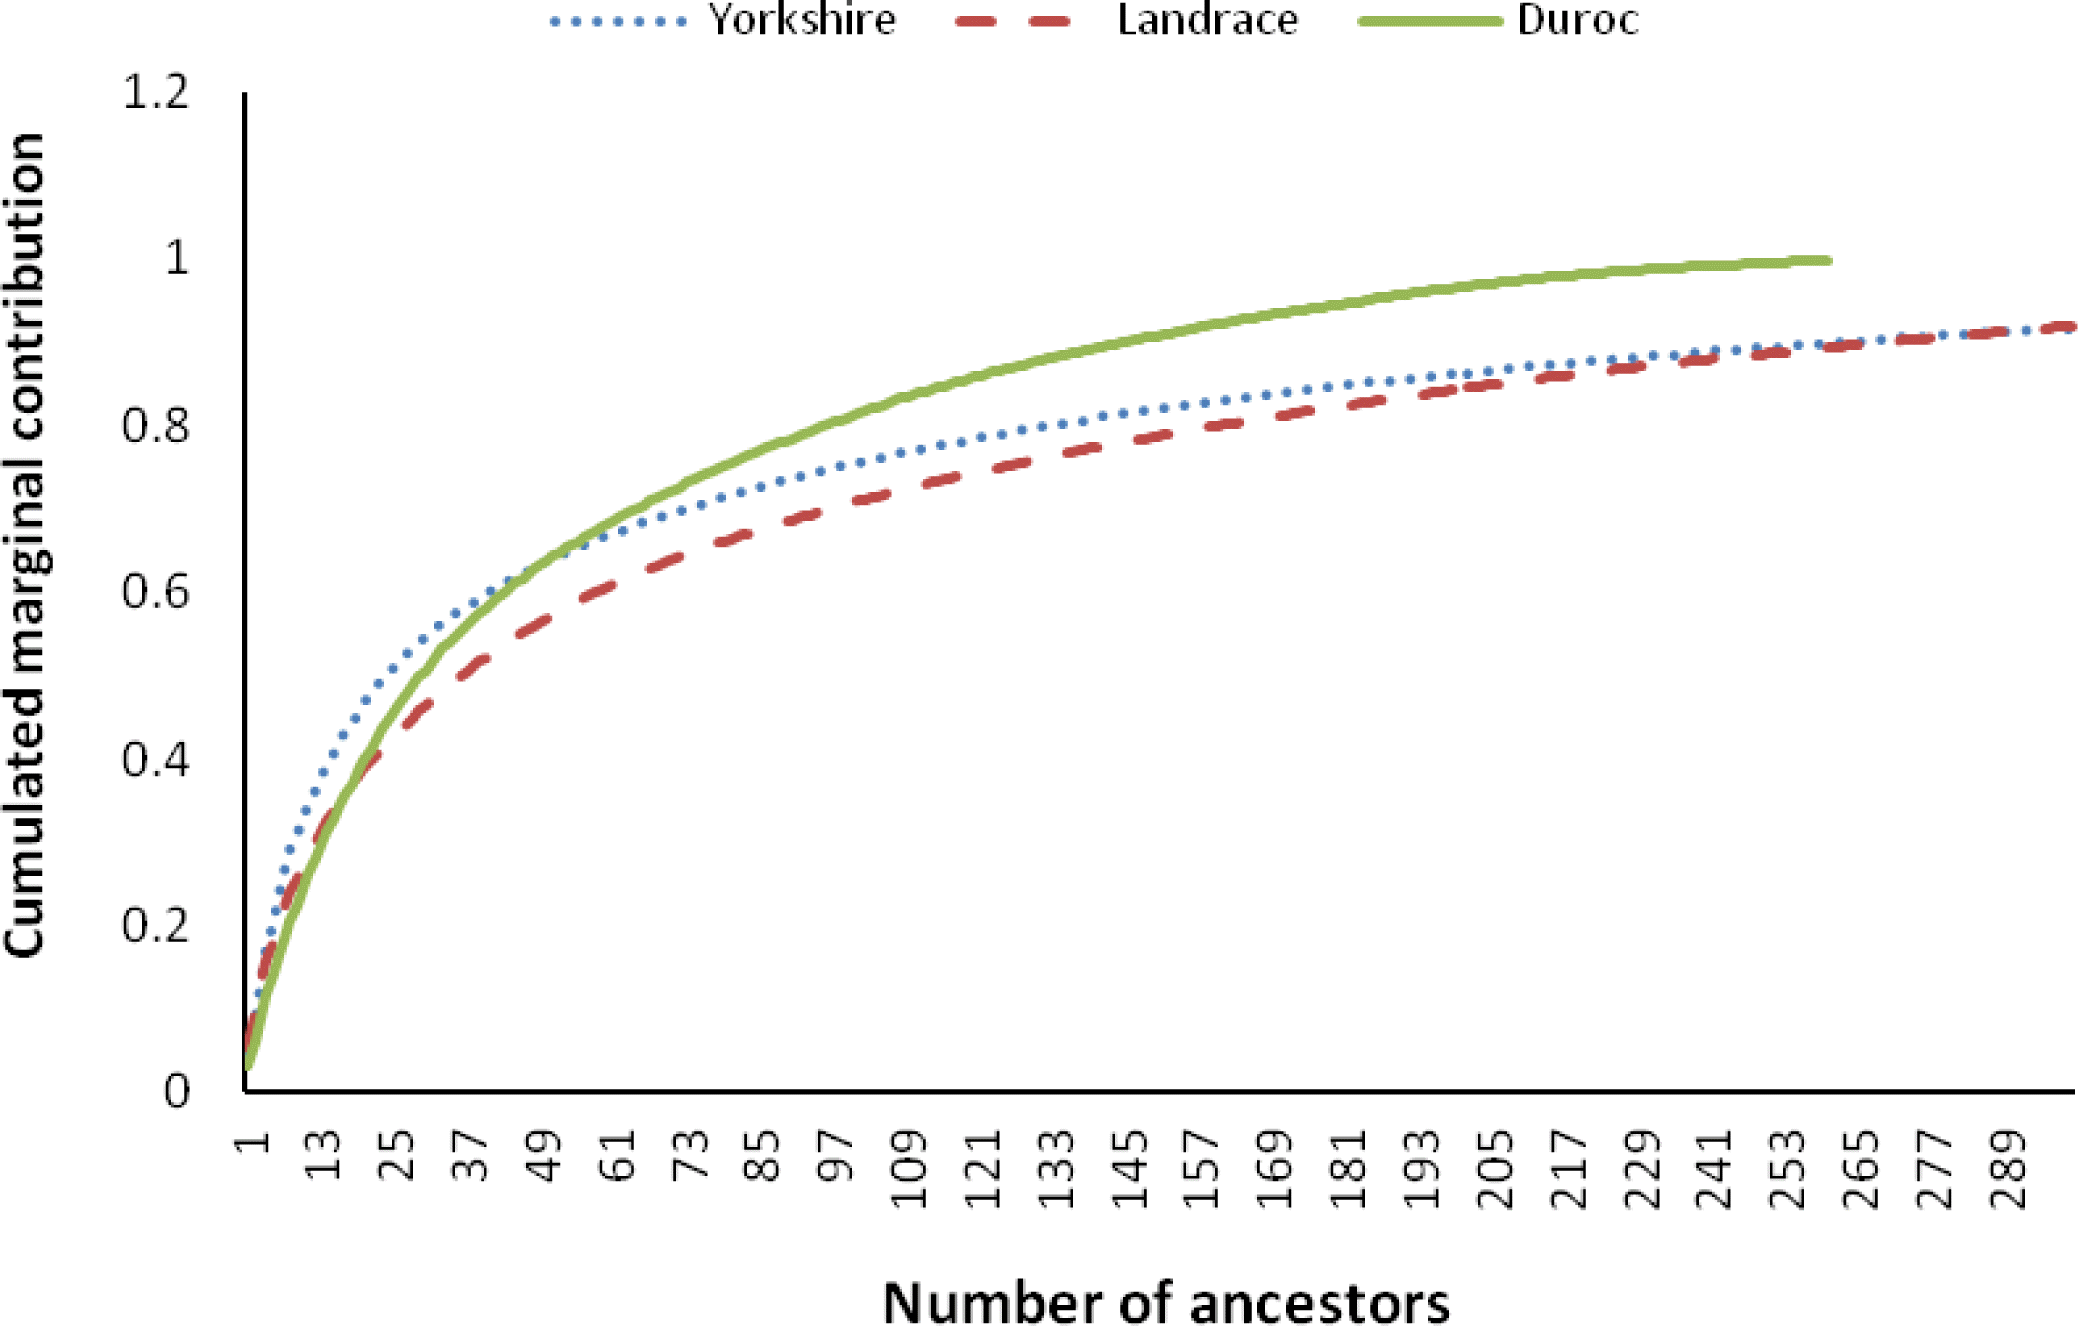
About 24 ancestors in CY explained 50% of gene pool in the reference population, while in CL and CD, more ancestors (36 and 30, respectively) were needed to contribute 50% to the current gene pool (Table 3). A total of 261 ancestors explained the whole gene pool of the reference population in CD. More ancestors of CY and CL were needed to explain 100% of the current gene pool (Table 3 and Figure 3). This indicates CY and CL have more genetic diversity than CD breed based on the ancestral contributions.
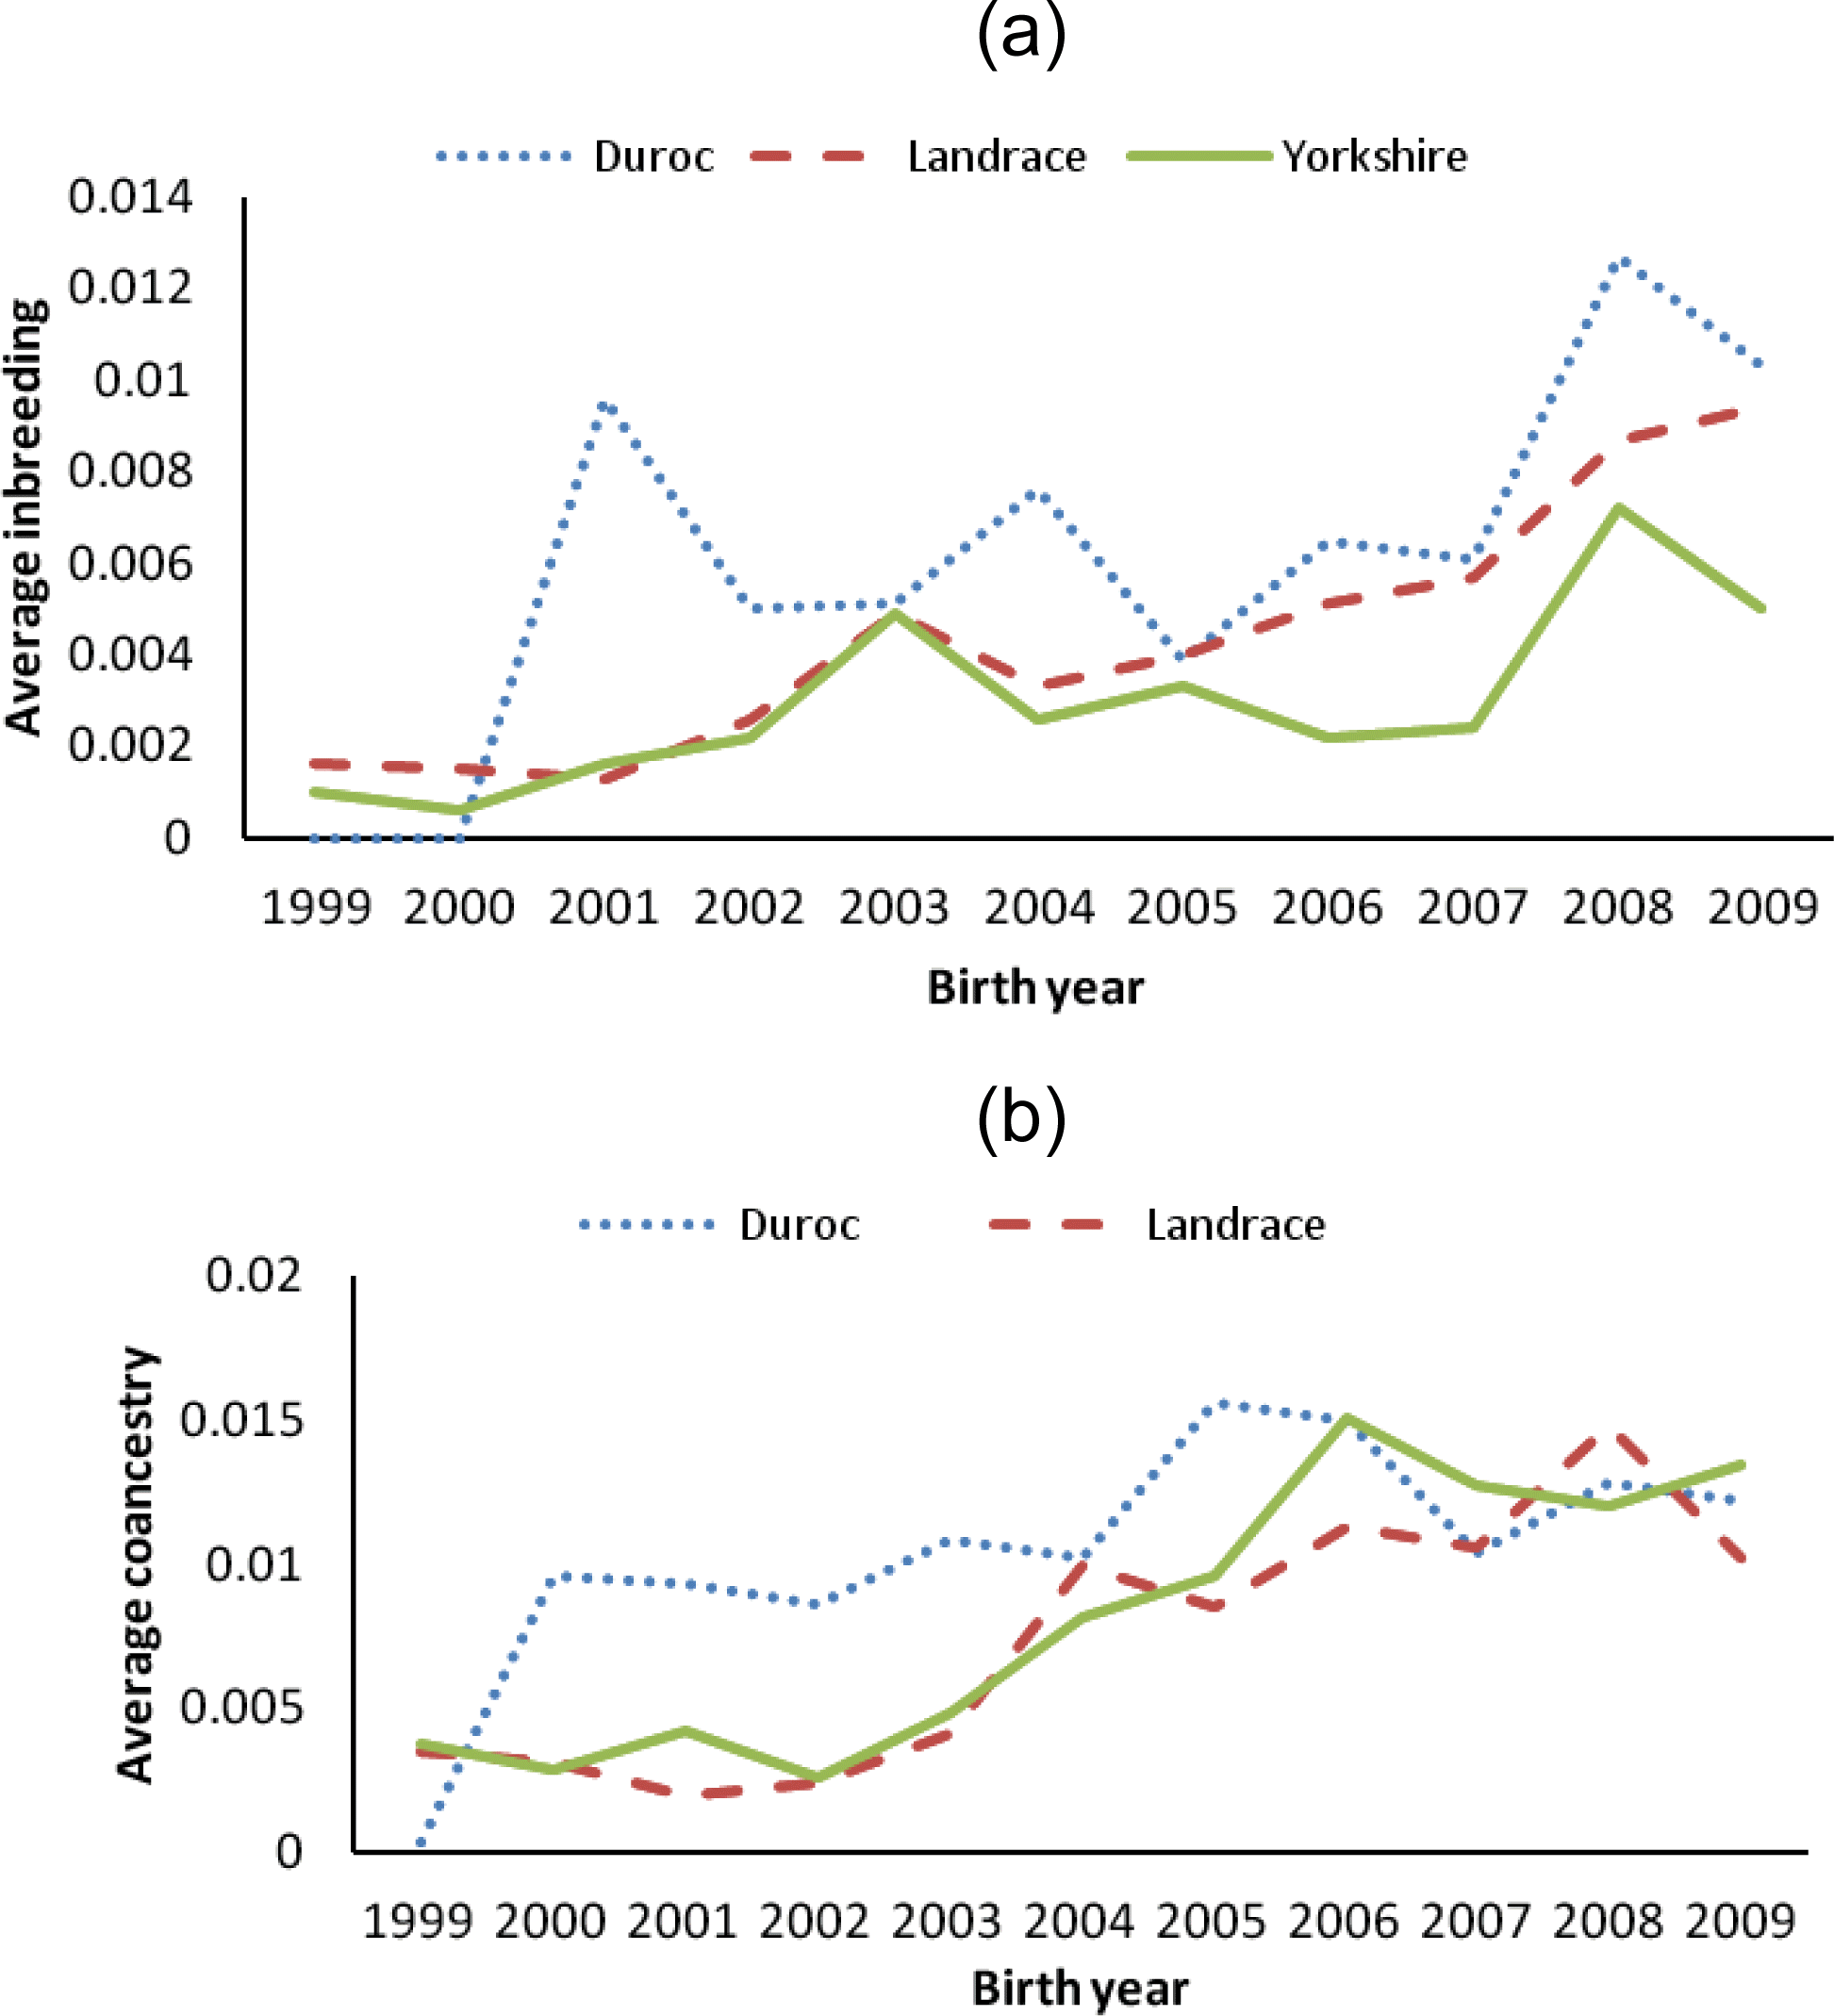
The percentages of inbreeding animals in the reference population for CD, CL and CY were low (29.24, 34.98 and 22.92, respectively, Table 2). Observing the changing trend of inbreeding coefficients over the last decade (Figure 4a), CY showed the least average inbreeding coefficient in the whole process, followed by CL, while CD had the highest inbreeding coefficient in the same period. The average inbreeding coefficients of three breeds were not over 1.3%, which were smaller than those values (4 to 18%) described by Melka and Schenkel (2010) and Welsh et al. (2010). This implied the inbreeding level of three imported swine breeds in Sichuan province was low. Figure 4b shows the trend of average coancestry between sires and dams, as expected, the trend was similar to the corresponding trend in expected inbreeding for CD.
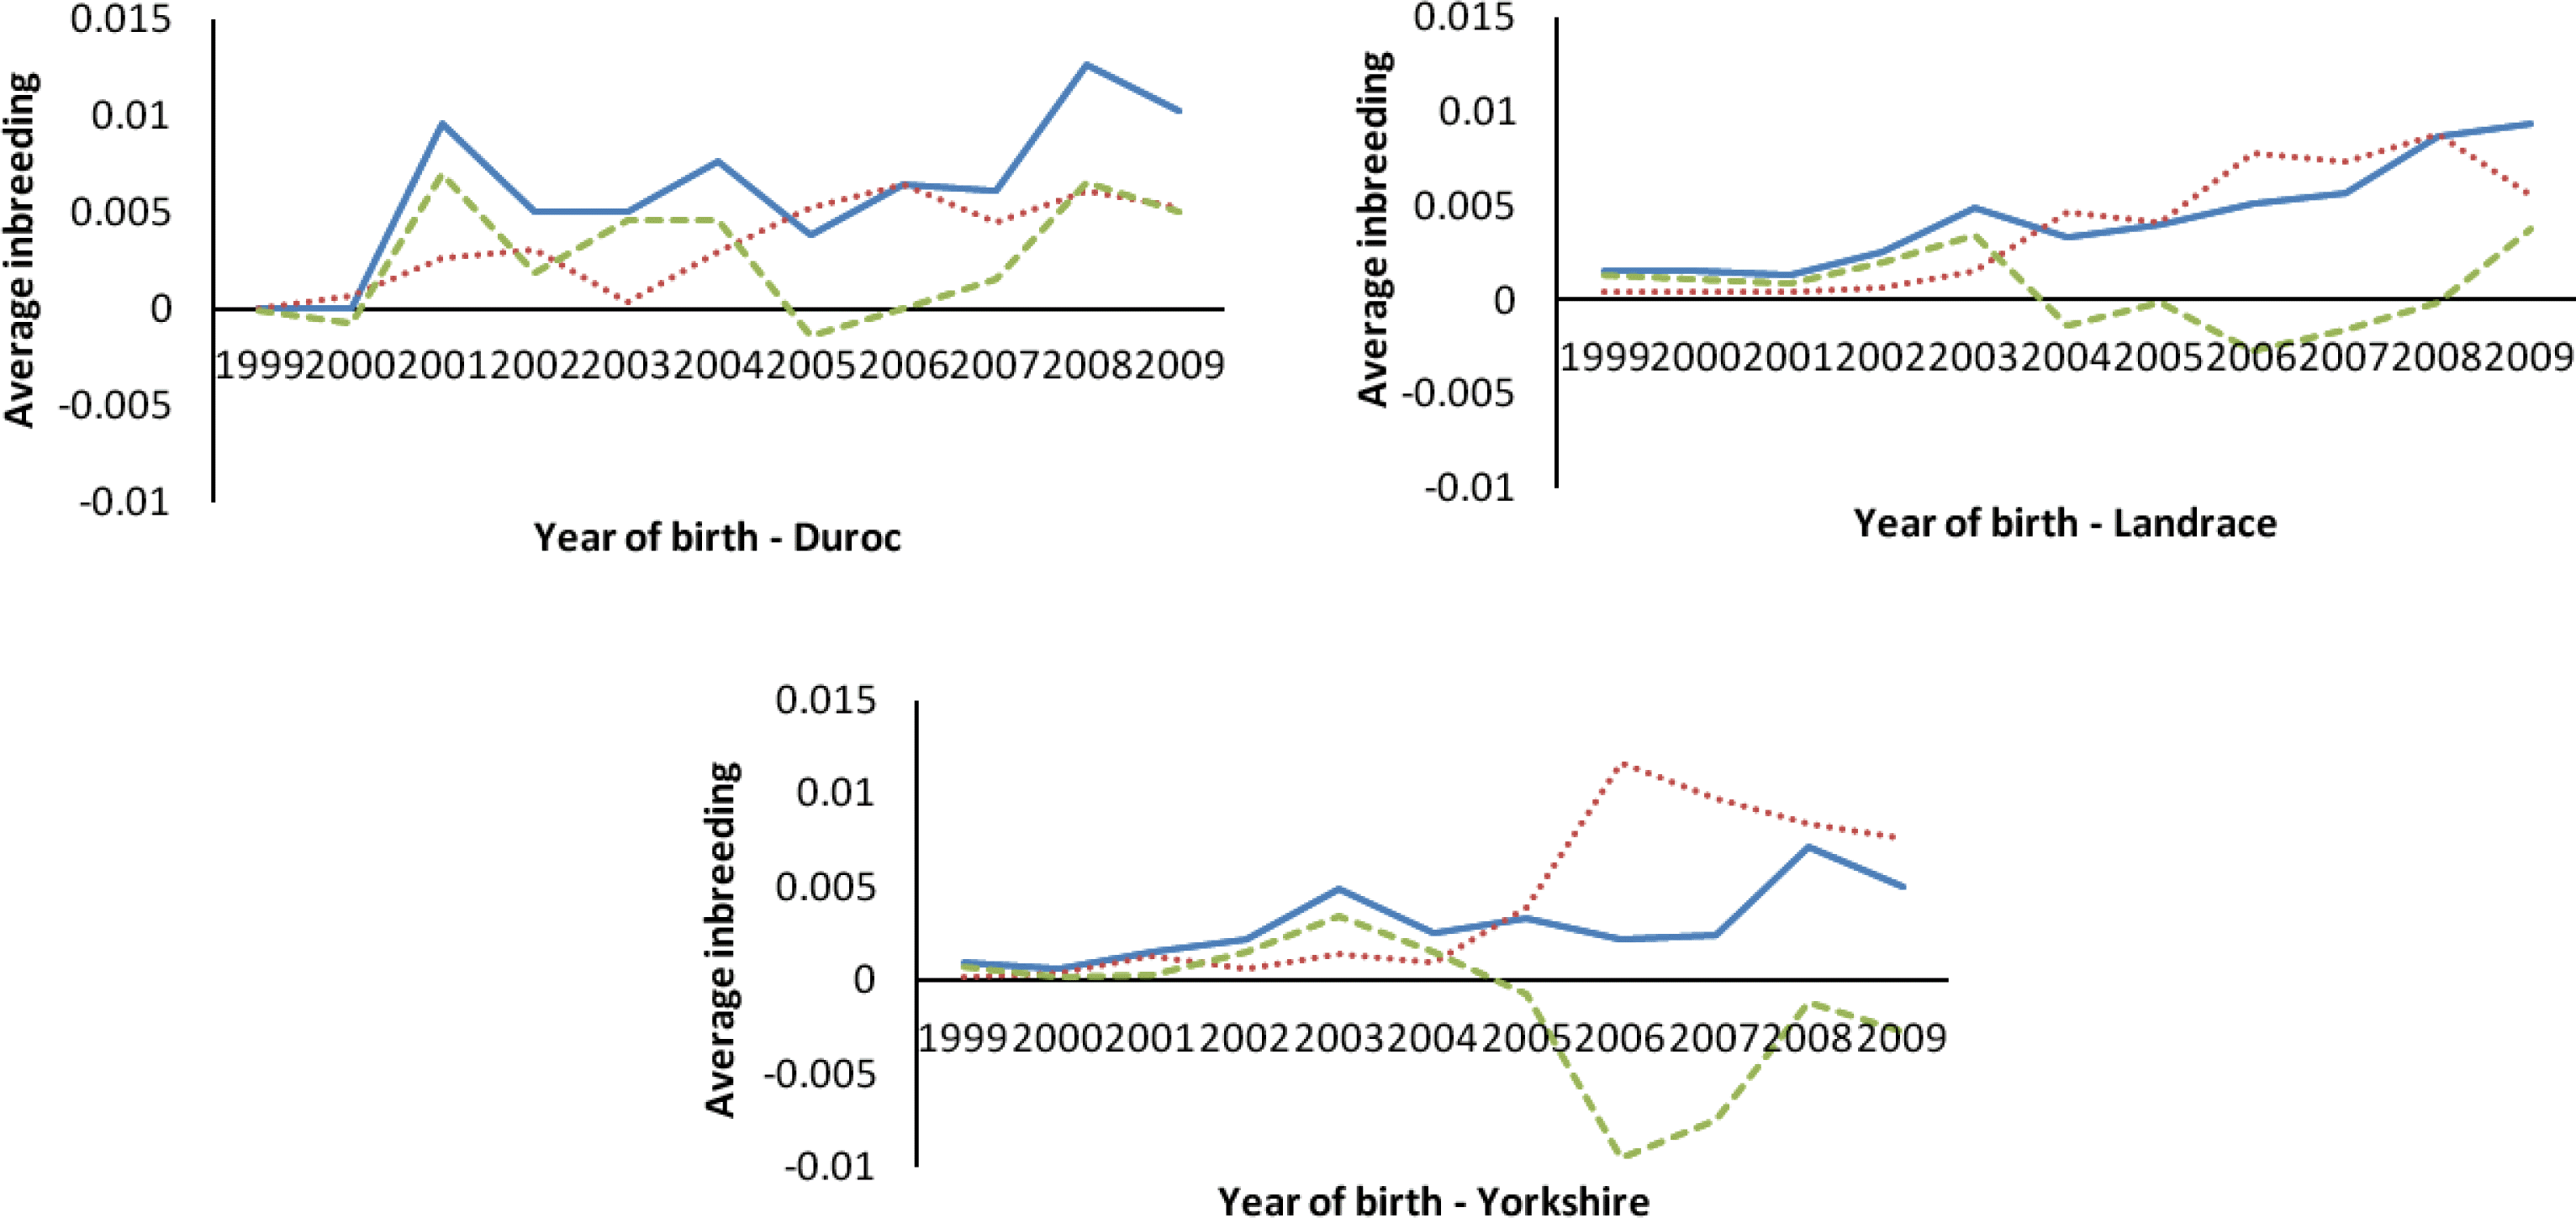
There has been considerable deviation of the actual inbreeding coefficient from expected inbreeding under random mating in each breed in the past decade (Figure 5). The deviations between the actual inbreeding and expected inbreeding for all years in CD were almost positive, whereas in CL and CY, it was positive before 2004, but mostly negative afterward.
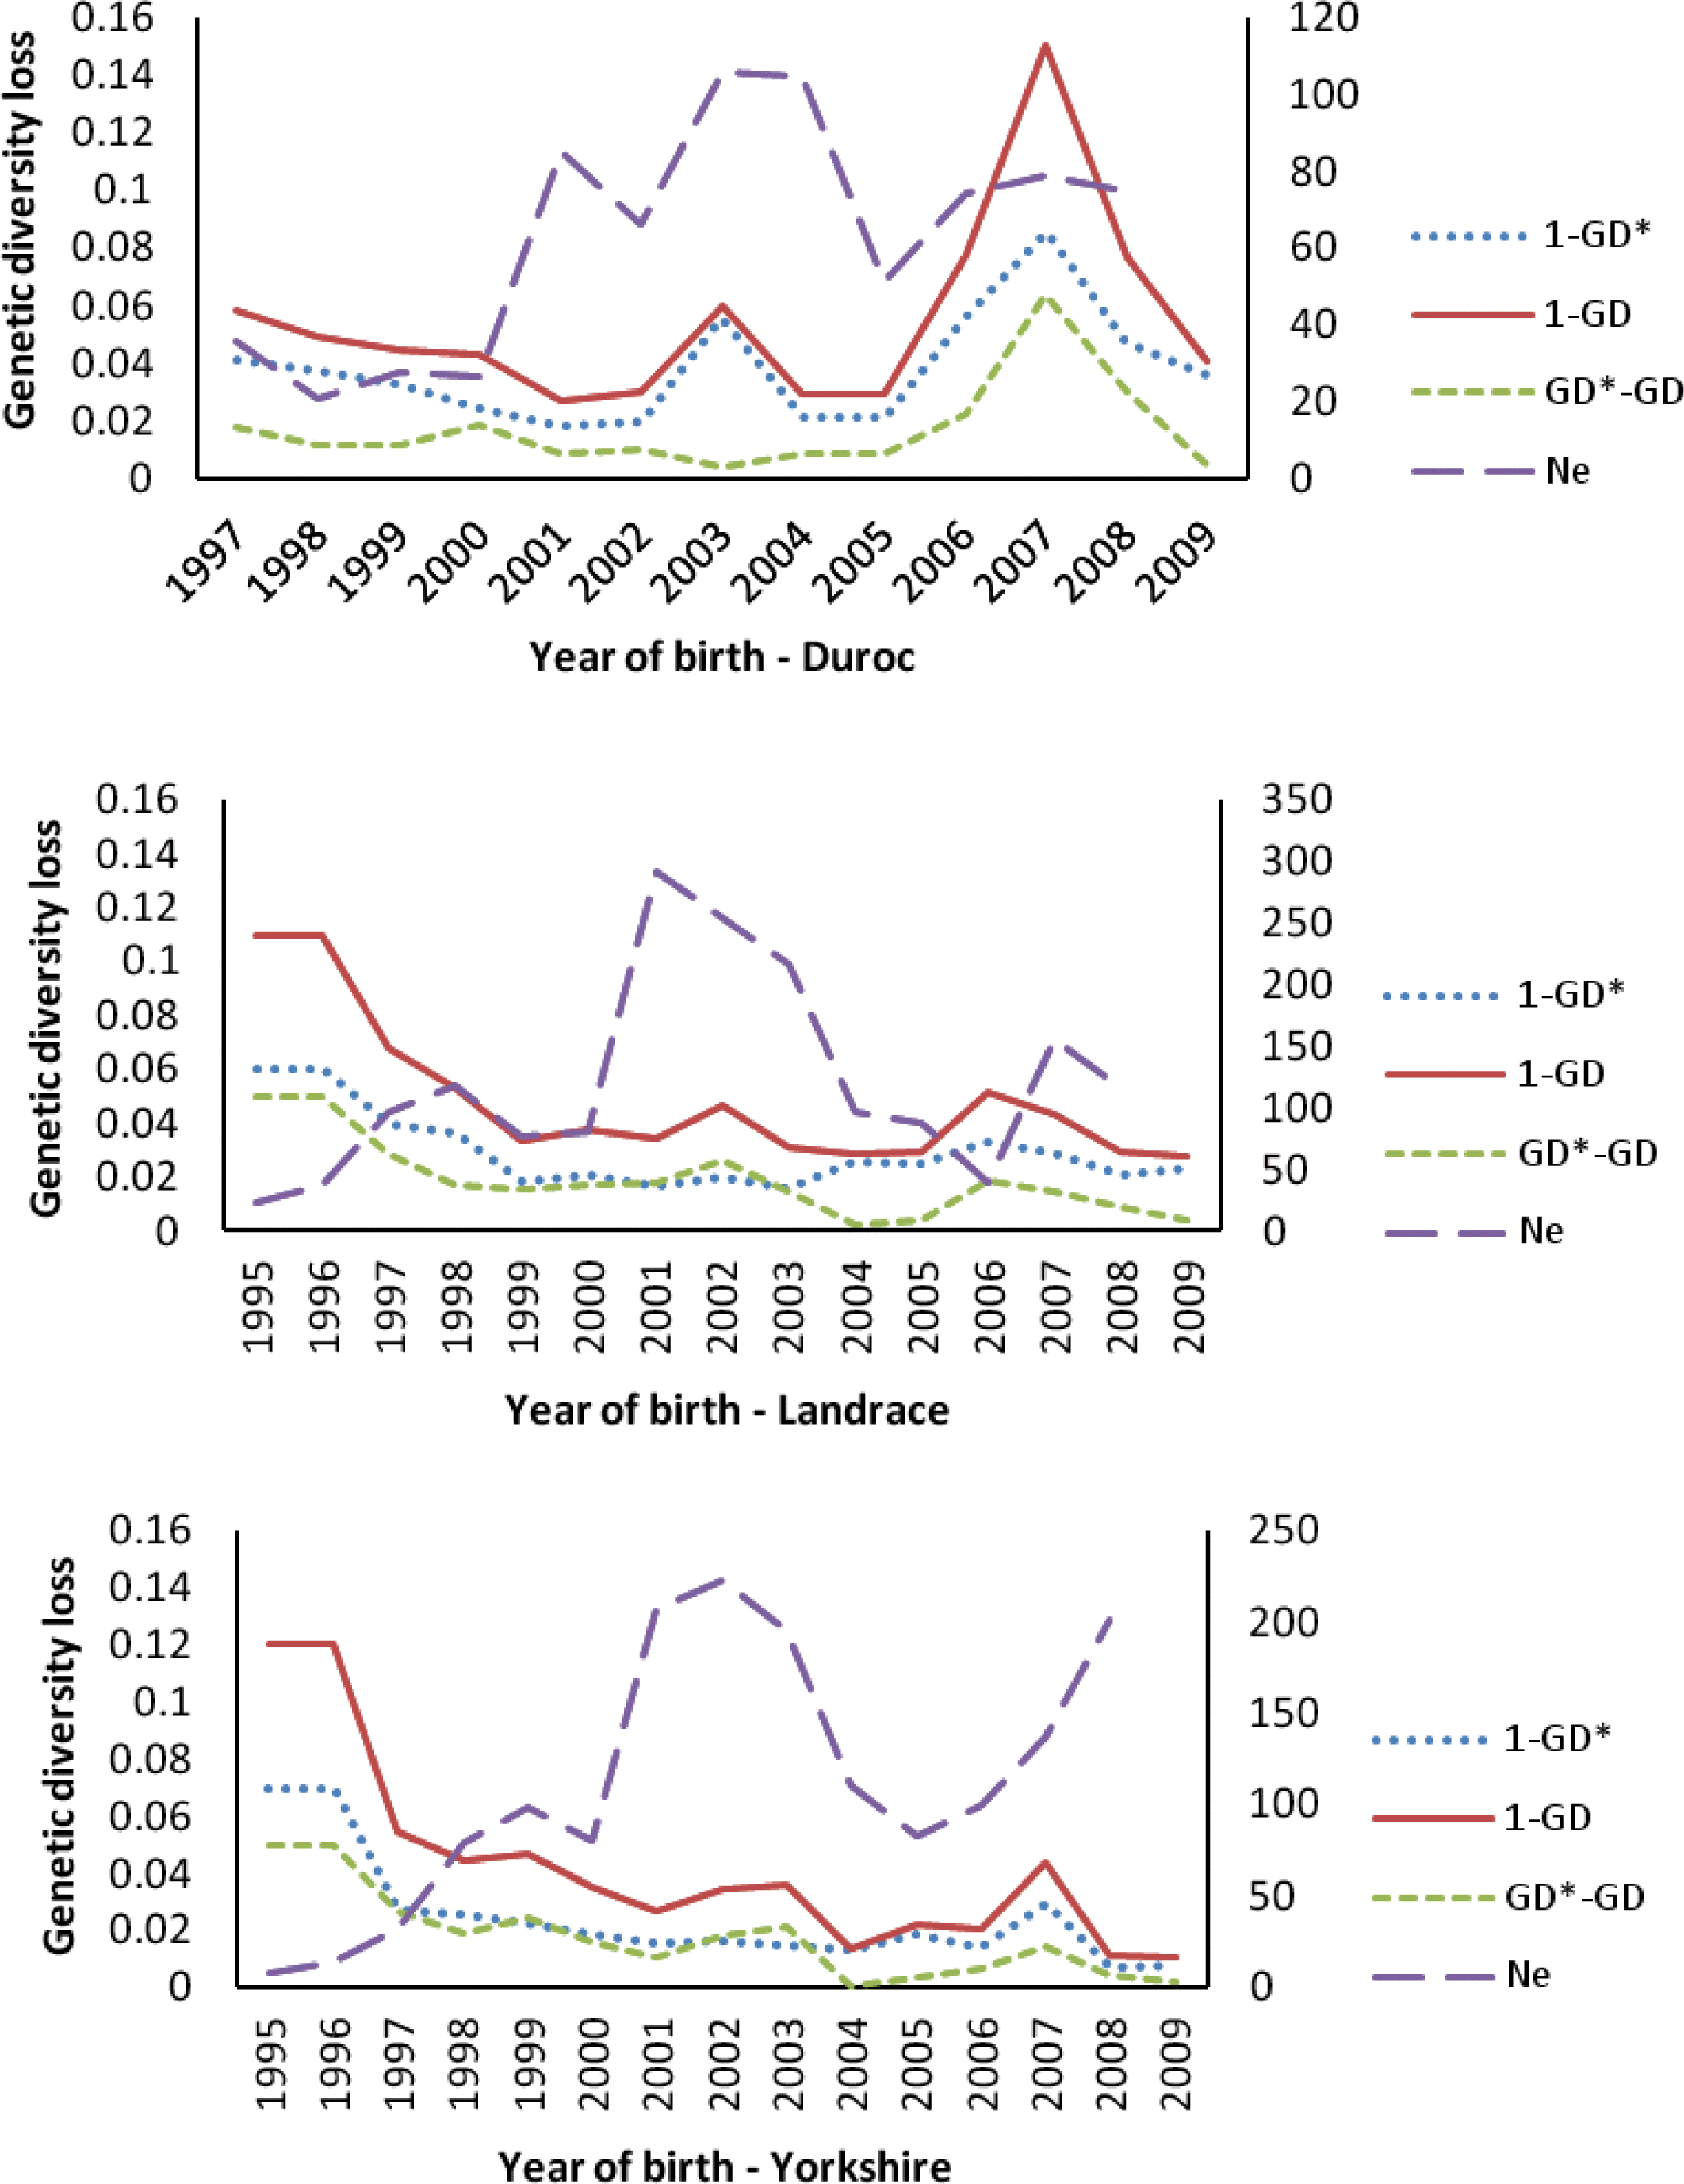
The amount of genetic diversity loss in the three Chinese breeds since 1995, due to different causes, is shown in Figure 6. In total, the amount of genetic diversity loss in CD increased gradually since 1996 and reached the highest (15% loss of genetic diversity) in the 2007, whereas in CL and CY, it was the highest (11 and 12%, respectively) in 1995 to 1996, and decreased gradually after that time. From this loss, average of about 63% (69.09, 57.95 and 60.57 for CD, CL and CY, respectively) over past decade could be attributed to unequal founder contributions. An average of about 37% (30.91, 42.05 and 39.43 for CD, CL and CY, respectively) of the genetic diversity loss was due to random genetic drift accumulated over nonfounder generations, caused mainly by the small effective population size. Figure 6 also shows the change in trend of effective population size (Ne) in three Chinese imported swine breeds. In total, the Ne of three Chinese swine breeds increased gradually since 1995, especially after 2000, the Ne of three swine breeds improved rapidly, and reached the highest in the period of 2001 to 2004. In the most recent two years (2008 to 2009), the Ne of CY increased rapidly, and exceeded 200 in the latest generation.
The overall depths of pedigree in three Chinese swine breeds were small. In Chinese Landrace (CL) and Yorkshire (CY), the PCI with 3 generation back was about 60%, only the PCI with 1 generation back exceeded 90%. The PCI of Chinese Duroc (CD) was even lower than CL and CY considering all generations back cases (Figure 2). Melka and Schenkel (2010) reported an average 4-generaton PCI of 90.4 and 89.6% for Canadian Duroc and Landrace born from 1978 to 2008, respectively. While in the current study, for the similar period, the PCI with 3 generations back was lower (45 and 65% for CD and CL, respectively) than Canadian swine breeds. The mean complete generations of CD and CL reached 1.59 and 1.85 in the whole pedigree, respectively. These values were lower than these reported in Canadian Duroc and Landrace (13 and 17.5, respectively) described by Melka and Schenkel (2010). Of course, the pedigree data in this study only involved records from 1993 to 2009, while the latter had records of about three decades before 2008. In addition, the Chinese swine production mode is introduction - degradation - re-introduction. In this case, the proportion of introduction was very large, moreover the period of re-introduction was short, which caused the genes of ancestors to be transferred for only a few generations.
The effective population size is the most important criterion to indicate the endangered status of breeds (Ruane, 2000). Melka and Schenkel (2010) reported an effective population size of 50 is necessary to withstand effects of inbreeding in a pig population, while a size of 500 is required to sustain the genetic diversity and evolutionary potential of the population for several generations. In this study, the effective population size for CD, CL and CY in the reference population (the present population) were 76, 117 and 202, respectively. These values are enough to resist the effect of inbreeding, but not to supply abundant diversity for genetic improvement in these populations. In addition, compared to the Ne of Duroc, Landrace and Yorkshire in other countries, the Ne of CD, CL and CY are in a reasonable range. For example, Melka and Schenkel (2010) reported the Ne of Canadian Duroc and Landrace was 72 and 125, respectively. Uimari and Tapio (2010) showed the Ne of Finnish Landrace and Yorkshire was 80 and 55, respectively. Welsh et al. (2010) also reported the Ne of American Duroc, Landrace and Yorkshire was 113, 74 and 113, respectively.
Maintaining within-breed genetic diversity for the long-term depends very much on the effort to increase effective population size, and balancing the contribution of ancestors to avoiding mating of much-related animals and reducing genetic drift (Simianer, 2005). In this study, a reference population was defined as piglets born from year 2008 to 2009 because the average generation interval for each breed was close to 2 yr (Table 2). The average generation interval in the reference population for CD and CL were 1.79 and 1.87, respectively (Table 2). These values were larger than Canadian Duroc and Landrace (1.60 and 1.73, respectively) in the same period as described by Melka and Schenkel (2010). This phenomenon is because the local farmers in Sichuan province prolong the lifespan (the longest lifetime of boars and sows exceeded 6 yrs) of boars and sows in production process. A lengthening lifespan of parents will increase the inbreeding level of a population because more full sibs or half sibs will be generated in the lengthened breeding period of parents. However, interestingly, the corresponding inbreeding level was still kept to a very low level (Figure 4a) in these populations, which was mainly due to new unrelated individuals being introduced often from other countries or regions. In the past, the production mode of Chinese imported pigs was introduction-degradation-re-introduction, which resulted in the swine nucleus population in Sichuan province being updated at intervals with foreign pig breeds. Therefore, a more efficient way to increase genetic diversity in Chinese swine populations may be directed towards increasing the effective population size of each breed by introducing genetically unrelated individuals between local farms or from other countries.
The parameters from the probabilities of gene origin are useful tools in measuring genetic diversity within breeds even after only a small number of generations (Boichard et al., 1997). The fe was one of those parameters that was used to assess whether or not there was a balanced contribution of founders (Lacy, 1989). If all founders were to contribute equally, the effective number of founders is equal to the total number of founders, however, the effective number is usually lower than total number of founders because of unequal contributions of founders due to selection. The comparison between fe and f demonstrates a loss in genetic diversity due to unequal contributions of founders, which could happen as a consequence of the excessive use of some animals as parents of subsequent generations (Melka and Schenkel, 2010). Moreover, the unequal contributions of founders will directly cause an increase of average inbreeding and coancestry in the reference population. The smaller the fe/f ratio, the greater the amount of loss of genetic diversity caused by the unequal contribution of founders. The fge is another very important parameter for measuring genetic diversity (Lacy, 1995). The fge indicates the loss of genetic diversity due to both unequal founder contribution and random genetic drift. The fge/fe ratio measures the impact of genetic drift excluding the effect of founder contribution on genetic diversity, so that lower ratios are associated with a higher impact of genetic drift. Melka and Schenkel (2010) reported the fge/fe ratio of Canadian Duroc, Lacombe, Hampshire and Landrace were 0.07, 0.07, 0.36 and 0.33, respectively. They concluded that the effect of random genetic drift was substantial in Canadian Duroc and Lacombe populations. In this study, CY and CL showed a high fge/fe ratio (0.31 and 0.32, respectively), which was close to the ratios of Canadian Hampshire and Landrace. This implies random genetic drift has smaller effect on genetic diversity loss than unequal founder contribution. Whereas in CD, both fe/f and fge/fe ratios were high (0.3 and 0.56, respectively), which showed the percentage of diversity loss caused by unequal founder contribution was larger in CD than in CY and CL.
For CY and CL, the actual average inbreeding coefficient tended to be smaller than expected inbreeding coefficient based on random mating since 2004 (Figure 5). In contrast, for CD, the actual inbreeding coefficient was almost higher than corresponding expected inbreeding coefficient since 2000. This implies that, in CY and CL, the mating strategies of local commercial farms in Sichuan province have improved since 2004, and the mating between animals with a high relationship has been avoided through the use of special breeding software (such as Netpig, registration mark in China: 2004SR05466). This action has efficiently controlled the increase of inbreeding. In CD, like CY and CL, the same mating strategy has been in place since 2004, and the corresponding inbreeding was also observed to decrease (Figure 5). However, the individuals in CD with higher than average coancestry were mated more often than the expected under the random mating, which indicates the mating strategy to minimize inbreeding (implemented in Netpig) has not been effective in this breed due to its smaller population size (<500 per year). Some studies indicate that the average coancestry is a good measure of genetic diversity because it accounts for both founder effects and the effects of genetic drift (Lacy, 1995; Meuwissen, 1997; Caballero and Toro, 2000). Considering the relationship between average coancestry and genetic diversity, Lacy (1995) demonstrated that selection with the objective of minimizing coancestry in the next generation would maximize genetic diversity. Therefore, application of minimum coancestry mating will be a good choice in Chinese swine breeds, especially in CD.
Overall, genetic diversity has been lost over the past decade in all Chinese swine breeds in this study, and this trend was obvious in CD. However, interestingly, for CY and CL, the highest amount of genetic diversity loss happened in 1995 to 1997, and then the amount of loss of genetic diversity decreased gradually after that period. At the latest (2009), the amount of genetic diversity loss for CL and CY decreased to 1.04 and 2.76%, respectively. Tracing the history of swine populations in Sichuan province, a closed breeding scheme with small population (<100 per year) and high selection intensity was implemented in 1993 to 1997, which caused serious unequal contributions of founders and random genetic draft (nearly each half, Figure 6), and a considerable amount (up to 12%) of genetic diversity was lost. After that, the amount of loss of genetic diversity decreased rapidly because the population size of commercial farms increased rapidly and more unrelated individuals from other countries (such as Denmark, Canada and American) were introduced termly.
The main cause (about 63%) of loss of genetic diversity in three Chinese swine breeds was shown to be unequal genetic contribution of founders. Random genetic drift and other factor (such as bottleneck) jointly contributed about 37% of the total loss of genetic diversity. However, Melka and Schenkel (2010) reported genetic drift was main factor (>60%) to cause the loss of genetic diversity in Canadian Duroc, Hampshire, Lacombe and Landrace swine breeds and unequal contribution of founders only contributed small fraction (<40%) of the loss of genetic diversity. Several other authors (e.g., Fern├Īndez et al., 2005; Melka et al., 2008) had also reported similar results. The excessive use of excellent boars and sows introduced from other countries in Sichuan province was the dominant cause of this difference, which caused very serious unequal contributions between founders. In addition, selection of breeding individuals and non-random mating between individuals selected are also important factors to cause the genetic diversity loss.
The Chinese Duroc was found to have lost a considerable amount of genetic diversity over the past decade. In contrast, Chinese Landrace and Yorkshire were found to have kept a high genetic diversity in recent years. Unequal contributions of founders played a major role in the loss of genetic diversity in all breeds, particularly in Chinese Duroc. Random genetic drift also showed substantial impact on the loss of genetic diversity, which is more obvious in Chinese Landrace than in Chinese Duroc and Yorkshire. Therefore, the results show that more favorable breeding strategies (such as increasing the effective population size and optimum contribution selection) should be implemented in Chinese swine breeds, especially in Chinese Duroc population.
ACKNOWLEDGMENTS
The financial supports from National Natural Science Foundation of China # 30771534, Key Project of Education Department in Sichuan Province #12ZA117, Earmarked Fund for China Agriculture Research System # CARS-36-05B and Science Fund for Young Scholars in Sichuan Agricultural University # 00232600 are greatly appreciated.
Figure┬Ā1.
The number of animals born per year in the Chinese Duroc (CD), Landrace (CL) and Yorkshire (CY) breeds.
Figure┬Ā2.
Pedigree completeness index accounting for 1 (PCI1), 3 (PCI3), 5 (PCI5) and 7 (PCI7) generations for all animals in the Chinese Duroc (CD), Landrace (CL) and Yorkshire (CY) breeds.
Figure┬Ā3.
Cumulated marginal contribution of 300 major ancestors in the Chinese Duroc (CD), Landrace (CL) and Yorkshire (CY) breeds.
Figure┬Ā4.
The trend of average inbreeding (a) and coancestry (b) over past decade in the Chinese Duroc (CD), Landrace (CL) and Yorkshire (CY) breeds.
Figure┬Ā5.
Actual inbreeding (solid line), the level of inbreeding expected under random mating (dotted line) and the deviation between the actual and expected (broken line) in the Chinese Duroc (CD), Landrace (CL) and Yorkshire (CY) breeds.
Figure┬Ā6.
Genetic diversity loss (left axis) due to unequal founder contribution and random genetic drift (1-GD), due only to unequal founder contribution (1-GD*), due only to random genetic diversity (GD*-GD), and effective population size (Ne, right axis) in Chinese Duroc (CD), Landrace (CL) and Yorkshire (CY) breeds.
Table┬Ā1.
Number of animals in the whole pedigree file and in the reference population (2008ŌĆō2009), maximum generation traced, mean maximum generations, mean complete generations, mean equivalent generation in the whole pedigree file, percentage of known ancestors in a given generation for Chinese Duroc (CD), Landrace (CL) and Yorkshire (CY) breeds
Table┬Ā2.
Effective population sizes (Ne), the percentage of inbreeding animals, generation intervals of male and female genetic pathways and the average generation interval (La) in years, in the reference population (2008ŌĆō2009) for Chinese Duroc (CD), Landrace (CL) and Yorkshire (CY) breeds
| Breed | Ne┬▒SD | Inbred animals (%) |
Generation interval
|
||
|---|---|---|---|---|---|
| Male | Female | La | |||
| Duroc | 76┬▒21.55 | 29.24 | 1.72 | 1.84 | 1.79 |
| Landrace | 117┬▒42.50 | 34.98 | 1.64 | 2.08 | 1.87 |
| Yorkshire | 202┬▒65.13 | 22.92 | 1.67 | 1.87 | 1.78 |
Table┬Ā3.
Parameters derived from the probability of gene origin in the most recent years (2008ŌĆō2009) for Chinese Duroc (CD), Landrace (CL) and Yorkshire (CY) breeds
REFERENCES
Alves E, Ovilo C, Rodriguez MC, Silio L. 2003. Mitochondrial DNA sequence variation and phylogenetic relationships among Iberian pigs and other domestic and wild pig populations. Anim Genet 34:319ŌĆō324.


Berg P. 2003. EVA version 1.4. Evolutionary algorithm for mate selection. UserŌĆÖs guide. Danish Institute of Agricultural Sciences; Foulum, Denmark:
Boichard D, Maignel L, Verrier E. 1997. The value of using probabilities of gene origin to measure genetic variability in a population. Genet Sel Evol 29:5ŌĆō23.


Boichard D. 2002. PEDIG: a fortran package for pedigree analysis suited for large populations. In : Proceedings of the 7th World Congress on Genetics Applied to Livestock Production; p. 19ŌĆō23. INRA, Castanet-Tolosan; France:
Barker JSF. 2001. Conservation and management of genetic diversity: a domestic animal perspective. Can J For Res 31:588ŌĆō595.

Caballero A, Toro MA. 2000. Interrelations between effective population size and other tools for management of conserved populations. Genet Res 75:331ŌĆō343.


FAO. 2000. Secondary guidelines for development of farm animal genetic resources management plans. Management of small populations at risk. FAO; Rome, Italy:
FAO. 2007. The state of the worldŌĆÖs animal genetic resources for food and agriculture. UN Food and Agric Org; http://www.fao.org/docrep/010/a1250e/a1250e00.htm. Accessed Aug. 19, 2009.
Falconer DS, Mackay TFC. 1996. Introduction to quantitative genetics. Longman; Harlow:
Fern├Īndez J, Villanueva B, Pong-Wong R, Toro MA. 2005. Efficiency of the use of pedigree and molecular marker information in conservation programs. Genetics 170:1313ŌĆō1321.


Fernandes SD, Malovrh S, Kovac M, Cadavez VAP. 2010. Study of genetic diversity of B├Łsaro pigs breed by pedigree analysis. Uasvm Iasi Faculty of Animal Sciences 53:178ŌĆō182.
Guti├®rrez JP, Goyache F. 2005. A note on ENDOG: a computer program for analysing pedigree information. J Anim Breed Genet 122:172ŌĆō176.


Guti├®rrez JP, Cervantes I, Molina A, Valera M, Goyache F. 2008. Individual increase in inbreeding allows estimating realised effective sizes from pedigrees. Genet Sel Evol 40:359ŌĆō378.


Guti├®rrez JP, Cervantes I, Goyache F. 2009. Improving the estimation of realised effective population sizes in farm animals. J Anim Breed Genet 126:327ŌĆō332.


Honda T, Nomura T, Yamaguchi Y, Mukai F. 2004. Monitoring of genetic diversity in the Japanese Black cattle population by the use of pedigree information. J Anim Breed Genet 121:242ŌĆō252.

Lacy RC. 1987. Loss of genetic diversity from managed populations. Interacting effects of drift, mutation, immigration, selection and population subdivision. Conserv Biol 1:143ŌĆō158.

Lacy RC. 1989. Analysis of founder representation in pedigrees: Founder equivalents and Founder genome equivalents. Zoo Biol 8:111ŌĆō123.

Lacy RC. 1995. Classification of genetic terms and their use in the management of captive populations. Zoo Biol 14:565ŌĆō578.

MacCluer JW, Boyce AJ, Dyke B, Weitkamp LR, Pfennig DW, Parsons CJ. 1983. Inbreeding and pedigree structure in Standardbred horses. J Hered 74:394ŌĆō399.

Maignel L, Boichard D, Verrier E. 1996. Genetic variability of French dairy breeds estimated from pedigree information. Interbull Bull 14:49ŌĆō54.
Melka MG, Stachowicz K, Sargolzaei M, Miglior F, Schenkel FS. 2008. Assessment of genetic diversity in Canadian colored dairy breeds using pedigree data. Proc Canadian Soc Anim Sci Annu Mtg. Guelph; Ontario, Canada:
Melka MG, Schenkel F. 2010. Analysis of genetic diversity in four Canadian swine breeds using pedigree data. Can J Anim Sci 90:331ŌĆō340.

Meuwissen THE. 1997. Maximizing the response of selection with predefined rate of inbreeding. J Anim Sci 75:934ŌĆō940.


Ruane J. 2000. A framework for prioritizing domestic animal breeds for conservation purposes at the national level: A Norwegian case study. Conserv Biol 14:1385ŌĆō1393.

Sargolzaei M, Iwaisaki H, Colleau JJ. 2005. A fast algorithm for computing inbreeding coefficients in large populations. J Anim Breed Genet 122:325ŌĆō331.


Sargolzaei M, Iwaisaki H, Colleau JJ. 2006. CFC: A tool for monitoring genetic diversity. Proceedings of the 8th World Congress on Genetics Applied to Livestock Production. p. 27ŌĆō28. Belo Horizonte; Brazil:
Simianer H. 2005. Using expected allele number as objective function to design between and within breed conservation of farm animal biodiversity. J Anim Breed Genet 122:177ŌĆō187.


S├Ėrensen AC, S├Ėrensen MK, Berg P. 2005. Inbreeding in Danish dairy cattle. J Dairy Sci 88:1865ŌĆō1872.


Uimari P, Tapio M. 2010. Extent of linkage disequilibrium and effective population size in Finnish Landrace and Finnish Yorkshire pig breeds. J Anim Sci 89:609ŌĆō614.


Vicente AA, Carolino MI, Sousa MCO, Ginja C, Silva FS, Martinez AM, Vega-Pla JL, Carolino N, Gama LT. 2008. Genetic diversity in native and commercial breeds of pigs in Portugal assessed by microsatellites. J Anim Sci 86:2496ŌĆō2507.


Welsh CS, Stewart TS, Schwa C, Blackburn HD. 2010. Pedigree analysis of 5 swine breeds in the United States and the implications for genetic conservation. J Anim Sci 88:1610ŌĆō1618.


Woolliams J. 2007. Genetic contributions and inbreeding. p. 147ŌĆō165. Oldenbroek K, editorUtilization and conservation of farm animal genetic resources. Wageningen Academic Publishers; Wageningen, the Netherlands:
- TOOLS
-
METRICS

- Related articles
-
Modeling and Forecasting Livestock Feed Resources in India Using Climate Variables2012 April;25(4)


 PDF Links
 PubReader
 ePub Link
 Full text via DOI
 Full text via PMC
 Download Citation
 Print
Print


