Go to Top Go to Bottom
Anim Biosci > Volume 34(1); 2021 > Article
Seo, Van Ba, Seong, Kim, Kang, Seol, Kim, Moon, Choi, and Cho: Relationship between body size traits and carcass traits with primal cuts yields in Hanwoo steers

Abstract

Objective

This study was conducted to evaluate the correlation between body size traits, carcass traits, and primal cuts in Hanwoo steers.

Methods

Sixty-one beef carcasses were classified for conformation and primal cut weight. Additionally, carcass weight, fat thickness, carcass dimensions, and longissimus muscle area were determined to complement the grading.

Results

The average live weight and cold carcass weight were 759 and 469 kg, respectively. The mean carcass meat, fat, and bone proportions were 551, 298, and 151 g/kg, respectively. Primal cuts weights showed significant positive correlations (p<0.001) of 0.42 to 0.82 with live weight, carcass weight, and longissimus muscle area and a significant negative correlation with carcass fat (without shank, −0.38 to −0.10). Primal cut weights were positively correlated (p<0.01) with carcass length (0.41 to 0.77), forequarter length (0.33 to 0.57), 6th lumbar vertebrae–heel length (0.33 to 0.59), 7th cervical vertebrae carcass breadth (0.35 to 0.58), 5th to 6th thoracic vertebrae breadth (0.36 to 0.65), 7th to 8th thoracic vertebrae girth (0.38 to 0.63), and coxae girth (0.34 to 0.56) and non-significantly related to cervical vertebrae length and coxae thickness.

Conclusion

There was a high correlation among live weight, carcass weight, longissimus muscle area, carcass length, 7th cervical vertebrae carcass breadth, 5th to 6th thoracic vertebrae breadth, and 7th to 8th thoracic vertebrae girth of the primal cuts yield. The correlation between fat and primal cut yields was highly significant and negative. Carcass length and 7th to 8th thoracic vertebrae girth, appear to be the most important traits affecting primal cut yields.

INTRODUCTION

Beef carcass grading systems are used to estimate the yield and determine the eating quality (palatability) of saleable meat. The meat industry in developed countries is showing trends toward marketing of individual muscle cuts to improve the value of retail meat cuts [1]. Both meat yield and distribution are the primary determinant of carcass value, which affect the value of meat cuts [2]. Studies have been conducted to examine the characteristics affecting carcass yield grade and retail product weight [37] and the retail product weight is mainly predicted based on the carcass weight (CW), longissimus dosi area, and carcass fat thickness (FT) [810]. A few studies have focused on the relationship between carcass scores and carcass composition values. The CW and carcass muscle score account for 38% of total variations in meat yield, with the carcass muscle score accounting for most of this value [11]. The CW alone, CW with carcass muscle score, and CW with carcass muscle and fat scores accounted for 0.1%, 37.9%, and 46.7%, respectively, of the total variation in saleable meat yield [12]. Carcass conformation and fat scores cause moderate to high variation in carcass meat yield [2,12,13]. Recent studies [2,13] showed that carcass classification for conformation and fatness explained 0.55 to 0.70 of total variation in the carcass meat proportion. Studies [12,13] have revealed correlations of 0.6 to 0.7 between muscular scores in the live animal and meat yield. A correlation has been observed between carcass measurements and primal cuts; as the CW increased, the retail product weight increased but the retail cut yield decreased [14]. The objectives of this study were to determine the relationship between instrumental body size traits and carcass traits with primal cuts yields. The fat and bone proportions, derived from body size traits and carcass traits, were used in our predictions.

MATERIALS AND METHODS

Animal care

The animal use and protocols employed during the research were reviewed and approved by the Institutional Animal Care and Use Committee (IACUC) at National Institute of Animal Science (approval number NIAS 20001992).

Animals and management

A total of 61 Hanwoo steers at 28 to 35 months of age was slaughtered at an abattoir of National Institute of Animal Science (Wanju, Korea). The slaughter of the cattle was carried out following the Guidelines of Animal Protection Law (Article 6) [15], and Livestock Sanitation Control Act Law (Annex 1) [16]. After chilling for 21 h at 1°C, the carcasses were weighed and dressing percentage was calculated.

Carcass evaluations and measurements

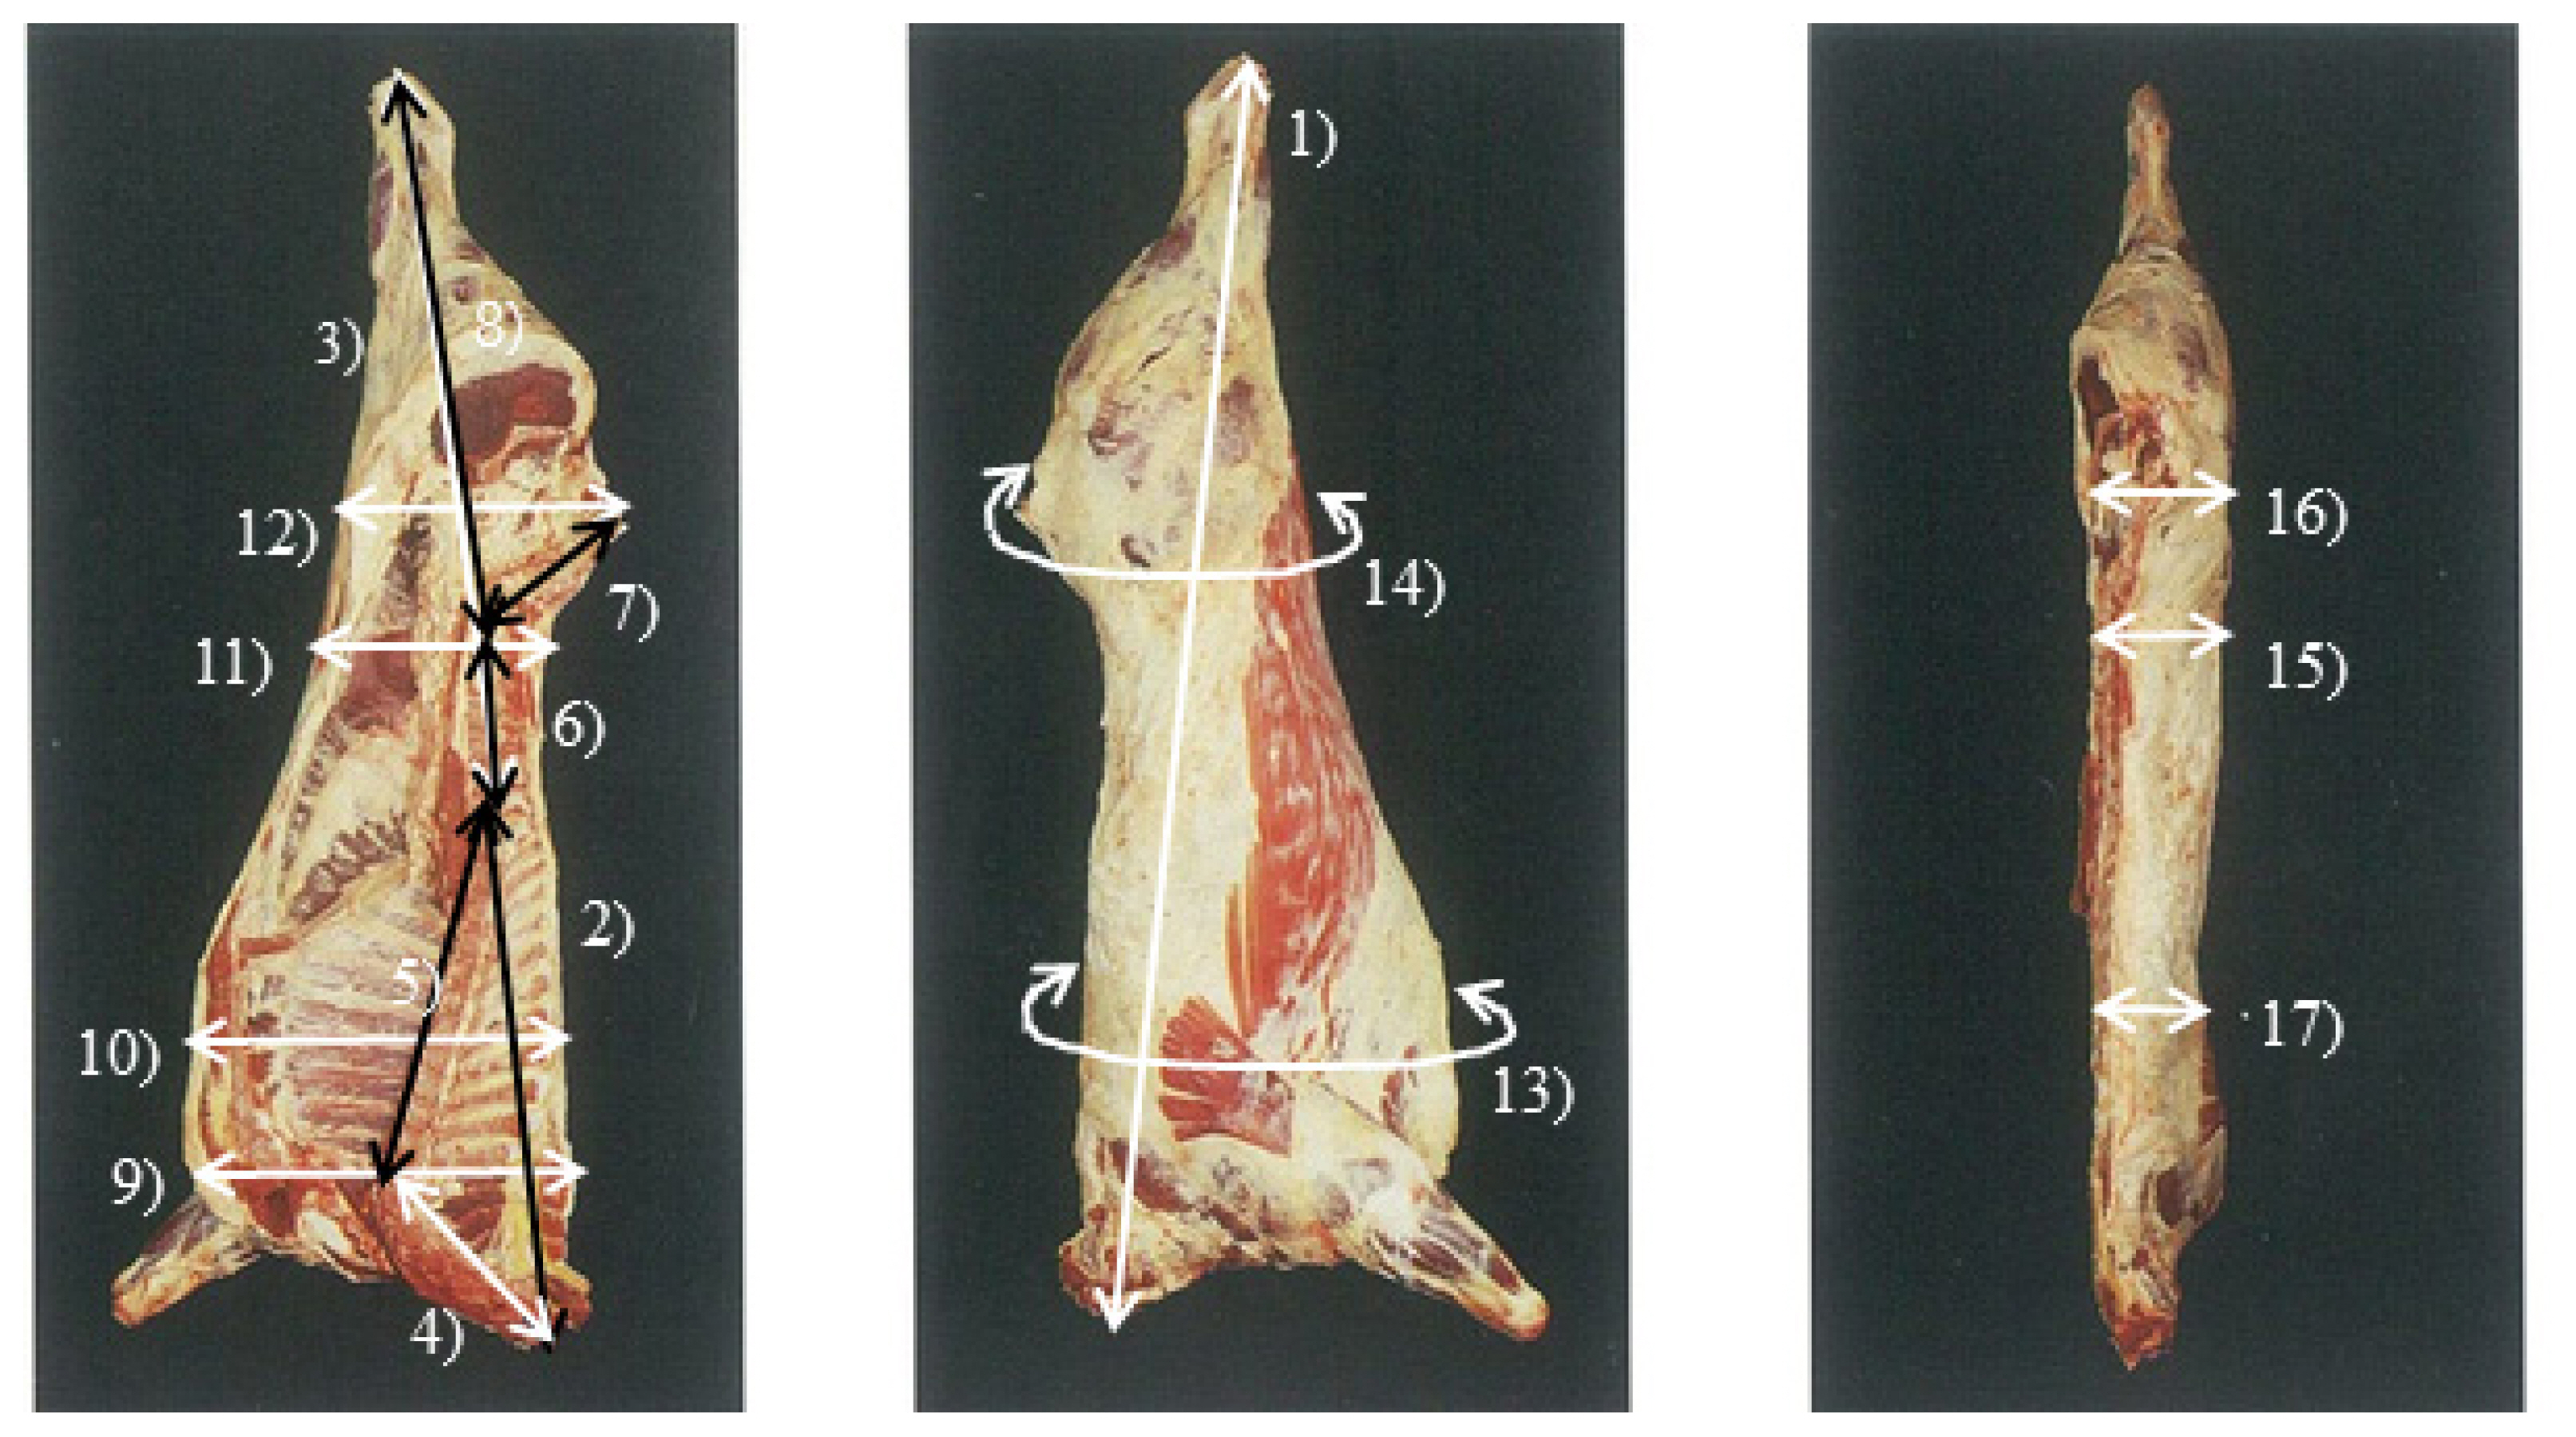
Carcasses were measured for carcass length (CL), forequarter length, hindquarter length, cervical vertebrae length (CVL), thoracic vertebrae length, lumbar vertebrae length, sacral vertebrae length, 6th lumbar vertebrae to heel length, 7th cervical vertebrae carcass breadth (CVB), 5th to 6th thoracic vertebrae breadth (TVB), 4th to 5th lumbar vertebrae breadth, 5th sacral vertebrae breadth (SVB), 7th to 8th thoracic vertebrae girth (TVG), coxae girth, 4th to 5th lumbar vertebrae thick (LVT), coxae thick (CT), 7th to 8th thoracic vertebrae thick (TVT) (Figure 1), FT, and longissimus muscle area (LMA). After recording the weight, the carcass was dissected into 10 cuts (tenderloin, loin, strip lion, chuck, clod, top round, bottom round, brisket, shank, and ribs) from which all visible fat and bone (where applicable) was removed. Carcass value was estimated as the sum of the commercial value of each meat cut with a small deduction for bone expressed as a proportion of CW.

Statistical analysis

Data were analysed using Proc REG and CORR of the Statistical Analysis Systems Institute [17]. Simple correlation coeAfficients of carcass measurements and carcass conformation with the various carcass traits were carried out using Pearson’s correlations.

RESULTS

Carcass characteristics

Abbreviations for the measurements collected in the study are provided in Table 1. The means and standard deviations for carcass traits are provided in Table 2. The average live weight (LW) and cold CW were 759.72±59.35 and 469.58± 41.14 kg, respectively. Mean carcass meat, fat, and bone proportions were 551.03±25.89, 297.71±33.70, and 151.27±10.73 kg, respectively. The average primal cuts weight was 8.16±0.89 kg for tenderloin, 38.47±3.74 kg for loin, 10.39±1.09 kg for strip loin, 21.64±2.72 kg for chuck roll, 29.39±3.49 kg for clod, 25.82±2.69 kg for top round, 40.73±4.30 kg for bottom round, 44.47±4.80 kg for brisket, 13.45±2.21 kg for shank, and 58.14 ±6.89 kg for ribs. The carcass characteristics and meat composition data were similar to those found in previous studies [18,19].

Correlation analyses: carcass traits

Simple correlations between carcass measurements and carcass primal product are presented in Table 3. As expected, the traits most strongly associated with primal cuts weight were LW, CW, and LMA. As CW increased, carcass dimensions and primal cut yields increased [6,2022]. Based on the values obtained for primal cuts, positive correlations were obtained using the CW with tenderloin proportion (r = 0.78), loin proportion (r = 0.78), strip lion proportion (r = 0.72), chuck roll proportion (r = 0.50), clod proportion (r = 0.72), top round proportion (r = 0.75), bottom round proportion (r = 0.76), brisket proportion (r = 0.76), shank proportion (r = 0.67), and ribs proportion (r = 0.64). Carcass FT showed a positive relationship (r = 0.04 to 0.39) with tenderloin, loin, strip lion, brisket, shank, and ribs but a negative relationship (r = −0.02 to −0.16) with chuck roll, clod, top round, and bottom round. FT was the most useful predictor of percent retail product from the major primal; however, an adjustment concerning the amount of fat in other locations was recommended [23]. Fat cover classification was negatively correlated with the conformation score classification and other muscular development traits such as the leg width and perimeter in both categories [24]. Other studies observed correlations between FT and carcass retail cut ranging from −0.52 to −0.73 [23,2528].
Positive correlations (p<0.001) were obtained between the LMA and tenderloin proportion (r = 0.54), loin proportion (r = 0.68), strip lion proportion (r = 0.73), chuck roll proportion (r = 0.42), clod proportion (r = 0.50), top round proportion (r = 0.59), bottom round proportion (r = 0.59), brisket proportion (r = 0.52), and ribs proportion (r = 0.55). Correlation coefficients between LMA and retail cut estimates reported previously showed r-values of 0.51 to 0.53 [20,29] and 0.62 to 0.70 [21,25,30,31]. The use of LMA to predict subprimal yield is controversial. Numerous studies have tested the usefulness of LMA for predicting cutability, which revealed a correlation between the ribeye area and both subprimal cut yields and major primal weights (r-values between 0.64 and 0.45) [21,23,32]. However, the USDA yield grade is not strongly influenced by LMA [3335]. Using separable lean as a dependent variable, the loin eye area showed a low correlation with retail yield [36,37]. LMA exhibited a low but significant correlation with the percentage of retail product for the four primals but was not related to the weight of the retail product [6].

Correlation analyses: carcass size traits

Correlation coefficients (Table 3) determined using carcass size by CL showed positive correlations with the tenderloin proportion (r = 0.69), loin proportion (r = 0.50), strip lion proportion (r = 0.41), chuck roll proportion (r = 0.22), clod proportion (r = 0.77), top round proportion (r = 0.70), bottom round proportion (r = 0.76), brisket proportion (r = 0.55), shank proportion (r = 0.52), and ribs proportion (r = 0.43). Positive correlations (p<0.001) were obtained between TVG (7th to 8th thoracic vertebrae girth) and the tenderloin proportion (r = 0.59), loin proportion (r = 0.63), strip lion proportion (r = 0.54), clod proportion (r = 0.52), top round proportion (r = 0.61), bottom round proportion (r = 0.61), brisket proportion (r = 0.61), shank proportion (r = 0.42), and ribs proportion (r = 0.62). Negative correlations were obtained for the chuck roll proportion with SVB (r = −0.16), LVT (r = −0.06), CT (r = −0.12), and TVT (r = −0.09). Correlations between the primal cut weight with CVL and CT were poor and generally not significant.
The correlations between variables related to the leg volume, such as carcass width, leg depth, and leg perimeter, were highly significant for both commercial categories. However, the correlations among these muscle-related variables and those related to carcass size or skeletal size, such as CL and width between commercial categories [24]. The CL was positively related to the percentage of subprimal cuts from round and brisket, chuck, plate, and flank [38].

CONCLUSION

Development of a new prediction equation for determining Hanwoo yield is required because of changes in the Korean beef industry; for example, the proportion of steers has dramatically increased, with slaughter weight of up to 760 kg. Our results showed that numerous variables in combination with body size or carcass traits can be used to more accurately estimate fat and carcass yields. There was a high correlation among LW, CW, LMA, CL, CVB, TVB, and TVG and primal cut yield. The correlation between fat and primal cut yields was highly negatively significant. The CL and TVG showed a high correlation with carcass yield. The relationship between carcass conformation and body size with carcass traits provides a basis for developing a carcass pricing structure that better reflects carcass value in terms of meat yield and distribution.

Notes

CONFLICT OF INTEREST

We certify that there is no conflict of interest with any financial organization regarding the material discussed in the manuscript. Sung-Sil Moon is an employee of Sunjin Meat Research Center.

ACKNOWLEDGMENTS

This study was supported by 2020 year Postdoctoral Fellowship Program (Project No. PJ01212501) of National Institute of Animal Science, Rural Development Administration, Republic of Korea.

Figure 1
Measurement of carcass size. 1) Carcass length, 2) forequarter length, 3) hindquarter length, 4) cervical vertebrae length, 5) thoracic vertebrae length, 6) lumbar vertebrae length, 7) sacral vertebrae length, 8) 6th lumbar vertebrae to heel length, 9) 7th cervical vertebrae carcass breadth, 10) 5th to 6th thoracic vertebrae breadth, 11) 4th to 5th lumbar vertebrae breadth, 12) 5th sacral vertebrae breadth, 13) 7th to 8th thoracic vertebrae girth, 14) coxae girth, 15) 4th to 5th lumbar vertebrae thick, 16) coxae thick, 17) 7th to 8th thoracic vertebrae thick.
ajas-19-0809f1.jpg
Table 1
Description of acronyms
Acronym Definition
LW Live weight
CW Cold carcass weight
DP Dressing percentage (cold carcass weight×100/live weight)
LMA Longissimus dosi area
FT Carcass fat thickness
CL Carcass length
FL Forequarter length
HL Hindquarter length
CVL Cervical vertebrae length
TVL Thoracic vertebrae length
LVL Lumbar vertebrae length
SVL Sacral vertebrae length
LVHL 6th Lumbar vertebrae – heel length
CVB 7th Cervical vertebrae carcass breadth
TVB 5th to 6th Thoracic vertebrae breadth
LVB 4th to 5th Lumbar vertebrae breadth
SVB 5th Sacral vertebrae breadth
TVG 7th to 8th Thoracic vertebrae girth
CG Coxae girth
LVT 4th to 5th Lumbar vertebrae thick
CT Coxae thick
TVT 7th to 8th Thoracic vertebrae thick
Table 2
Mean, standard deviation (SD), minimum and maximum values of carcass traits and primal cuts yields1)
Items Mean SD Minimum Maximum
LW (kg) 759.72 59.35 627.00 900.00
CW (kg) 469.58 41.14 393.70 567.50
FT (mm) 16.33 6.71 7.00 40.00
LMA (cm2) 94.48 8.74 75.00 112.00
DP (%) 61.79 1.77 58.40 66.18
Meat (g/kg) 551.03 25.89 500.50 613.87
Fat (g/kg) 297.71 33.70 229.08 363.15
Bone (g/kg) 151.27 10.73 130.46 174.66
CL (cm) 264.46 8.57 244.00 285.00
FL (cm) 114.79 4.84 101.00 124.00
HL (cm) 150.28 5.55 139.00 163.00
CVL (cm) 45.89 5.54 38.00 84.00
TVL (cm) 80.08 3.76 65.00 86.00
LVL (cm) 42.37 2.55 35.00 50.00
SVL (cm) 35.52 3.48 27.00 42.00
LVHL (cm) 107.54 7.24 84.00 130.00
CVB (cm) 81.62 3.57 70.00 89.00
TVB (cm) 81.70 3.20 75.00 90.00
LVB (cm) 45.26 2.95 39.00 53.00
SVB (cm) 50.48 3.45 45.00 62.00
TVG (cm) 179.54 5.46 168.00 188.00
CG (cm) 132.85 4.88 122.00 144.00
LVT (cm) 25.13 3.50 18.00 34.00
CT (cm) 21.69 2.83 14.00 28.00
TVT (cm) 21.00 3.17 13.00 30.00
Tenderloin (kg) 8.16 0.89 6.61 10.39
Loin (kg) 38.47 3.74 29.50 46.86
Strip loin (kg) 10.39 1.09 8.37 13.31
Chuck roll (kg) 21.64 2.72 15.67 27.94
Clod (kg) 29.39 3.49 23.43 39.25
Top round (kg) 25.82 2.69 20.35 32.20
Bottom round (kg) 40.73 4.30 32.53 48.67
Brisket (kg) 44.47 4.80 34.10 57.75
Shank (kg) 13.45 2.21 8.15 19.57
Ribs (kg) 58.14 6.89 42.53 75.02

LW, live weight; CW, cold carcass weight; FT, carcass fat thickness; LMA, Longissimus dosi area; DP, dressing percentage (cold carcass weight×100/live weight); CL, carcass length; FL, forequarter length; HL, hindquarter length; CVL, cervical vertebrae length; TVL, thoracic vertebrae length; LVL, lumbar vertebrae length; SVL, sacral vertebrae length; LVHL, 6th lumbar vertebrae – heel length; CVB, 7th cervical vertebrae carcass breadth; TVG, 7th to 8th thoracic vertebrae girth; CG, coxae thick; LVT, coxae girth, 4th to 5th lumbar vertebrae thick; CT, coxae thick; TVT, 7th to 8th thoracic vertebrae thick.

1) Beef primal cuts [39].

Table 3
Simple correlation coefficients between carcass grades, carcass weight, fat thickness, carcass size and yield of primal product
Trait Beef primal cuts1)

Tenderloin Loin Strip loin Chuck roll Clod Top round Bottom round Brisket Shank Ribs
LW (kg) 0.81*** 0.76*** 0.65*** 0.46*** 0.77*** 0.81*** 0.82*** 0.75*** 0.61*** 0.65***
CW (kg) 0.78*** 0.78*** 0.72*** 0.50*** 0.72*** 0.75*** 0.76*** 0.76*** 0.67*** 0.64***
FT (mm) 0.04 0.04 0.15 −0.16 −0.02 −0.07 −0.04 0.16 0.39** 0.05
LMA (cm2) 0.54*** 0.68*** 0.73*** 0.42*** 0.50*** 0.59*** 0.59*** 0.52*** 0.24 0.55***
DP (%) 0.16 0.30* 0.40** 0.28* 0.10 0.06 0.09 0.23 0.38** 0.16
Meat (g/kg) 0.31* 0.21 0.15 0.14 0.38** 0.39** 0.37** 0.21 −0.26* 0.06
Fat (g/kg) −0.28* −0.16 −0.08 −0.10 −0.38** −0.38** −0.38** −0.13 0.31* −0.06
Bone (g/kg) 0.13 0.01 −0.10 −0.03 0.28* 0.26* 0.29* −0.09 −0.35** 0.06
CL (cm) 0.69*** 0.50*** 0.41*** 0.22 0.77*** 0.70*** 0.76*** 0.55*** 0.52*** 0.43***
FL (cm) 0.56*** 0.47*** 0.33** 0.39** 0.57*** 0.47*** 0.56*** 0.41** 0.41** 0.33*
HL (cm) 0.50*** 0.31* 0.20 0.01 0.56*** 0.50*** 0.53*** 0.38** 0.35** 0.30*
CVL (cm) 0.23 0.24 0.13 0.20 0.17 0.24 0.23 0.15 0.23 0.14
TVL (cm) 0.42*** 0.32** 0.20 0.31* 0.34** 0.36** 0.41** 0.15 0.29* 0.23
LVL (cm) 0.29* 0.24 0.08 0.05 0.27* 0.28* 0.21 0.18 0.22 0.12
SVL (cm) 0.28* 0.19 0.34** 0.06 0.30* 0.32* 0.29* 0.40* −0.04 0.32*
LVHL (cm) 0.57*** 0.55*** 0.41** 0.29* 0.59*** 0.57*** 0.58*** 0.58*** 0.33* 0.48***
CVB (cm) 0.51*** 0.45*** 0.43*** 0.35** 0.52*** 0.55*** 0.58*** 0.52*** 0.44*** 0.39**
TVB (cm) 0.50*** 0.47*** 0.49*** 0.41*** 0.45*** 0.64*** 0.65*** 0.38** 0.41*** 0.36**
LVB (cm) 0.43*** 0.29* 0.46*** 0.09 0.40** 0.37** 0.50*** 0.35** 0.33* 0.21
SVB (cm) 0.35** 0.32* 0.32* −0.16 0.35** 0.26* 0.29* 0.38** 0.22 0.32*
TVG (cm) 0.59*** 0.63*** 0.54*** 0.38** 0.52*** 0.61*** 0.61*** 0.61*** 0.42*** 0.62***
CG (cm) 0.44*** 0.39** 0.56*** 0.52*** 0.39** 0.49*** 0.53*** 0.40** 0.34** 0.35**
LVT (cm) 0.31* 0.24 0.34** −0.06 0.39** 0.37** 0.38** 0.39** 0.42*** 0.11
CT (cm) 0.05 0.08 0.18 −0.12 0.10 0.09 0.11 0.18 0.20 −0.02
TVT (cm) 0.26* 0.10 0.14 −0.09 0.35** 0.22 0.21* 0.27* 0.22 0.04

LW, live weight; CW, cold carcass weight; FT, carcass fat thickness; LMA, longissimus dosi area; DP, dressing percentage (cold carcass weight×100/live weight); CL, carcass length; FL, forequarter length; HL, hindquarter length; CVL, cervical vertebrae length; TVL, thoracic vertebrae length; LVL, lumbar vertebrae length; SVL, sacral vertebrae length; LVHL, 6th lumbar vertebrae – heel length; CVB, 7th cervical vertebrae carcass breadth; TVB, 5th to 6th thoracic vertebrae breadth; LVB, 4th to 5th lumbar vertebrae breadth; SVB, 5th Sacral vertebrae breadth; TVG, 7th to 8th thoracic vertebrae girth; CG, coxae thick; LVT, coxae girth, 4th to 5th lumbar vertebrae thick; CT, coxae thick; TVT, 7th to 8th thoracic vertebrae thick.

1) Beef primal cuts [39].

* p<0.05,

** p<0.01,

*** p<0.001.

REFERENCES

1. Joo ST, Kim GD, Hwang YH, Ryu YC. Control of fresh meat quality through manipulation of muscle fiber characteristics. Meat Sci 2013; 95:828–36. https://doi.org/10.1016/j.meatsci.2013.04.044
crossref pmid
2. Drennan MJ, McGee M, Keane MG. The value of muscular and skeletal scores in the live animal and carcass classification scores as indicators of carcass composition in cattle. Animal 2008; 2:752–60. https://doi.org/10.1017/S1751731108001754
crossref pmid
3. Crouse JD, Dikeman ME. Determinates of retail product of carcass beef. J Anim Sci 1976; 42:584–91. https://doi.org/10.2527/jas1976.423584x
crossref pdf
4. Abraham HC, Murphey CE, Cross HR, Smith GC, Franks WJ. Factors affecting beef carcass cutability: an evaluation of the USDA yield grades for beef. J Anim Sci 1980; 50:841–51. https://doi.org/10.2527/jas1980.505841x
crossref pdf
5. May SG, Mies WL, Edwards JW, et al. Beef carcass composition of slaughter cattle differing in frame size, muscle score, and external fatness. J Anim Sci 1992; 70:2431–45. https://doi.org/10.2527/1992.7082431x
crossref pmid pdf
6. Tait RG, Wilson DE, Rouse GH. Prediction of retail product and trimmable fat yields from the four primal cuts in beef cattle using ultrasound or carcass data. J Anim Sci 2005; 83:1353–60. https://doi.org/10.2527/2005.8361353x
crossref pmid pdf
7. Voges KL, Pfeiffer KD, Baird BE, et al. Retail cutting characteristics for US choice and US select beef subprimals. Meat Sci 2006; 73:116–31. https://doi.org/10.1016/j.meatsci.2005.11.005
crossref pmid
8. Miller MF, Cross HR, Baker JF, Byers FM, Recio HA. Evaluation of live and carcass techniques for predicting beef carcass composition. Meat Sci 1988; 23:111–29. https://doi.org/10.1016/0309-1740(88)90019-8
crossref pmid
9. Lu W, Tan J. Analysis of image-based measurements and USDA characteristics as predictors of beef lean yield. Meat Sci 2004; 66:483–91. https://doi.org/10.1016/S0309-1740(03)00139-6
crossref pmid
10. Lawrence TE, Farrow RL, Zollinger BL, Spivey KS. Technical note: the united states department of agriculture beef yield grade equation requires modification to reflect the current longissimus muscle area to hot carcass weight relationship. J Anim Sci 2008; 86:1434–8. https://doi.org/10.2527/jas.2007-0813
crossref pmid pdf
11. Lee JG, Lee SS, Cho KH, et al. Estimation of primal cuts yields by using body size traits in Hanwoo steer. J Anim Sci Technol 2013; 55:373–80. https://doi.org/10.5187/JAST.2013.55.5.373
crossref
12. Perry D, McKiernan WA, Yeates AP. Muscle score: its usefulness in describing the potential yield of saleable meat from live steers and their carcasses. Aust J Exp Agric 1993; 33:275–81. https://doi.org/10.1071/EA9930275
crossref
13. Perry D, Yeates AP, McKiernan WA. Meat yield and subjective muscle scores in medium weight steers. Aust J Exp Agric 1993; 33:825–31. https://doi.org/10.1071/EA9930825
crossref
14. Conroy SB, Drennan MJ, Kenny DA, McGee M. The relationship of live animal muscular and skeletal scores, ultrasound measurements and carcass classification scores with carcass composition and value in steers. Animal 2009; 3:1613–24. https://doi.org/10.1017/s1751731109990395
crossref pmid
15. Enforcement rule of the animal protection act. Sejong, Korea: A proposal of the animal protection law. Animal protection law enforcement regulation article 6 animal slaughter method. Ministry of Agriculture, Food and Rural Affairs No. 68; 2013. https://www.law.go.kr

16. Livestock Sanitation Control Act Law. Sejong, Korea: Livestock sanitation control act law enforcement regulation annex 1, Livestock products sanitary control act, Act No. 126272. Ministry of Food and Drug Safety; 2014. https://www.law.go.kr

17. SAS Institute Inc. SAS/STAT Software for PC. Release 9.4. Cary, NC, USA: SAS Institute Inc; 2014.

18. Lee JM, Hah KH, Kim JH, et al. Study on the carcass yield grade traits and prediction of retail product weight in Hanwoo beef. Food Sci Anim Resour 2008; 28:604–9. https://doi.org/10.5851/kosfa.2008.28.5.604
crossref pdf
19. Lee JG, Lee SS, Cho KH, et al. Correlation analyses on body size traits, carcass traits and primal cuts in Hanwoo steers. J Anim Sci Technol 2013; 55:351–8. https://doi.org/10.5187/jast.2013.55.5.351
crossref
20. Williams RE, Bertrand JK, Williams SE, Benyshek LL. Biceps femoris and rump fat as additional ultrasound measurements for predicting retail product and trimmable fat in beef carcasses. J Anim Sci 1997; 75:7–13. https://doi.org/10.2527/1997.7517
crossref pmid
21. Realini CE, Williams RE, Pringle TD, Bertrand JK. Gluteus medius and rump fat depths as additional live animal ultrasound measurements for predicting retail product and trimmable fat in beef carcasses. J Anim Sci 2001; 79:1378–85. https://doi.org/10.2527/2001.7961378x
crossref pmid
22. Greiner SP, Rouse GH, Wilson DE, Cundiff LV, Wheeler TL. Prediction of retail product weight and percentage using ultrasound and carcass measurements in beef cattle. J Anim Sci 2003; 81:1736–42. https://doi.org/10.2527/2003.8171736x
crossref pmid pdf
23. May SG, Mies WL, Edwards JW, et al. Using live estimates and ultrasound measurements to predict beef carcass cutability. J Anim Sci 2000; 78:1255–61. https://doi.org/10.2527/2000.7851255x
crossref pmid
24. Albertí P, Ripoll G, Goyache F, et al. Carcass characterisation of seven Spanish beef breeds slaughtered at two commercial weights. Meat Sci 2005; 71:514–21. https://doi.org/10.1016/j.meatsci.2005.04.033
crossref pmid
25. Maeno H, Oishi K, Mitsuhashi T, Kumagai H, Hirooka H. Prediction of carcass composition and individual carcass cuts of Japanese Black steers. Meat Sci 2014; 96:1365–70. https://doi.org/10.1016/j.meatsci.2013.11.017
crossref pmid
26. Apple JK, Dikeman ME, Cundiff LV, Wise JW. Determining beef carcass retail product and fat yields within 1 hour postmortem. J Anim Sci 1991; 69:4845–57. https://doi.org/10.2527/1991.69124845x
crossref pmid pdf
27. Herring WO, Williams SE, Bertrand JK, Benyshek LL, Miller DC. Comparison of live and carcass equations predicting percentage of cutability, retail product weight, and trimmable fat in beef cattle. J Anim Sci 1994; 72:1107–18. https://doi.org/10.2527/1994.7251107x
crossref pmid pdf
28. Greiner SP, Rouse GH, Wilson DE, Cundiff LV, Wheeler TL. Prediction of retail product weight and percentage using ultrasound and carcass measurements in beef cattle. J Anim Sci 2003; 81:1736–42. https://doi.org/10.2527/2003.8171736x
crossref pmid pdf
29. Lee JY, Lee JK, Kim JB. Relationship of major carcass grading traits with the related retail cut productivity traits in Hanwoo steers. J Agric Life Sci 2016; 50:99–111. https://doi.org/10.14397/jals.2016.50.4.99
crossref
30. Hamlin KE, Green RD, Cundiff LV, Wheeler TL, Dikeman ME. Real-time ultrasonic measurement of fat thickness and longissimus muscle area: II. Relationship between real-time ultrasound measures and carcass retail yield. J Anim Sci 1995; 73:1725–34. https://doi.org/10.2527/1995.7361725x
crossref pmid pdf
31. Choy YH, Choi SB, Jeon GJ, et al. Prediction of retail beef yield using parameters based on Korean beef carcass grading standards. Korean J Food Sci Anim Resour 2010; 30:905–9. https://doi.org/10.5851/kosfa.2010.30.6.905
crossref pdf
32. Cannell RC, Belk KE, Tatum JD, et al. Online evaluation of a commercial video image analysis system (Computer Vision System) to predict beef carcass red meat yield and for augmenting the assignment of USDA yield grades. United States Department of Agriculture. J Anim Sci 2002; 80:1195–201. https://doi.org/10.2527/2002.8051195x
crossref pmid pdf
33. Hamlin KE, Green RD, Perkins TL, Cundiff LV, Miller MF. Real-time ultrasonic measurement of fat thickness and longissimus muscle area: I. Description of age and weight effect. J Anim Sci 1995; 73:1713–24. https://doi.org/10.2527/1995.7361713x
crossref pmid pdf
34. Crews DH, Shannon NH, Crews RE, Kemp RA. Weaning, yearling, and preharvest ultrasound measures of fat and muscle area in steers, bulls, and heifers. J Anim Sci 2002; 80:2817–24. https://doi.org/10.2527/2002.80112817x
crossref pmid pdf
35. Wall PB, Rouse GH, Wilson DE, Tait RG, Busby WD. Use of ultrasound to predict body composition changes in steers at 100 and 65 days before slaughter. J Anim Sci 2004; 82:1621–9. https://doi.org/10.2527/2004.8261621x
crossref pmid pdf
36. Ramsey CB, Cole JW, Hobbs CS. Relation of beef carcass grades, proposed yield grades and fat thickness to separable lean, fat and bone. J Anim Sci 1962; 21:193–5. https://doi.org/10.2527/jas1962.212193x
crossref pdf
37. Hodgson RR, Belk KE, Savell JW, Cross HR, Williams FL. Development of a multivariate yield grade equation to predict compositional traits in mature cow carcasses. J Anim Sci 1992; 70:2159–66. https://doi.org/10.2527/1992.7072159x
crossref pmid pdf
38. Indurain G, Carr TR, Goñi MV, Insausti K, Beriain MJ. The relationship of carcass measurements to carcass composition and intramuscular fat in Spanish beef. Meat Sci 2009; 82:155–61. https://doi.org/10.1016/j.meatsci.2009.01.005
crossref pmid
39. KAPE. The primal cuts and sub-primal cuts in Korean evaluated. Korea Institute for Animal Products Quality Evaluation; 2020. https://www.ekape.or.kr


Editorial Office
Asian-Australasian Association of Animal Production Societies(AAAP)
Room 708 Sammo Sporex, 23, Sillim-ro 59-gil, Gwanak-gu, Seoul 08776, Korea   
TEL : +82-2-888-6558    FAX : +82-2-888-6559   
E-mail : editor@animbiosci.org               

Copyright © 2024 by Asian-Australasian Association of Animal Production Societies.

Developed in M2PI

Close layer
prev next