Go to Top Go to Bottom
Anim Biosci > Volume 31(3); 2018 > Article
Yu, Kim, Kim, Kim, Moon, Lee, Park, Jung, Chung, Shin, Nam, Choi, and Cho: Effects of Rubus coreanus byproducts on intestinal microbiota and the immune modulation

Abstract

Objective

Although the efficacy of Rubus coreanus (RC) byproducts as a feed additive has been recognized, its effects on intestinal microorganisms and the immune system are still unknown.

Methods

Six-week-old male rats were treated with 0.5% RC (T1), 1.0% RC (T2), and 1.5% RC (T3) for 4 weeks.

Results

We found that treatment with RC byproducts significantly increased the daily gain of body weight and feed intake. Treg-cell differentiation was enhanced in the mesenteric lymph nodes and spleen from the rats fed with RC byproducts. Illumina sequencing showed that bacteria in the phylum Firmicutes decreased and while those in the phylum Bacteroidetes increased in RC-treated groups. Particularly, the pathogenic microorganisms in the family Peptococcaceae decreased, and the non-pathogenic families Lachnospiraceae and S24-7 increased. Quantitative polymerase chain reaction analysis showed that the RC byproducts increased the lactic acid bacteria Bifidobacterium spp., Oscillospira spp., Leuconostoc citreum, and Weissella cibaria in a concentration-dependent manner.

Conclusion

RC byproducts may be effective in immunomodulation by affecting intestinal microorganisms.

INTRODUCTION

Antibiotics have been used as feed additives for the purpose of preventing disease, promoting growth, and improving feed efficiency in animals. As antibiotics can remain in livestock products such as meat, eggs, and milk causing antibiotic resistance in humans, their use is increasingly banned across countries. Recently, the number of antibiotics used as feed additives has been reduced from 53 to 23, and among the antibiotics used in 25 feed additives, the tetracycline series and seven generic antibiotics have been banned [1]. Due to these antibiotic restrictions in feed additives, various natural resource materials have been developed.
Rubus coreanus (RC) is a deciduous shrub belonging to the Rosaceae family and generally contains 87.0 g of water, 1.6 g of protein, 1.7 g of fat, 1.3 g of glucose, 2.9 g of fiber and 0.5 g of ash in 100 g as well as Ca, Mg, Na and Fe and vitamins such as vitamin A, vitamin B1, and vitamin C [2]. It has been reported that organic acids such as gallic acid, polyphenols such as quercetin, kaempferol, and tannins in RC have various anticancer, antioxidant, cholesterol-lowering and anti-obesity effects [3]. In addition, ellagitannins and ellagic acid, which possess anti-cancer, anti-diabetic and anti-inflammatory effects, are very poorly absorbed by the gastrointestinal system and the unabsorbed compounds are metabolized to urolithin by intestinal microorganisms [4]. As the activity of useful ingredients in RC has been reported, various functional products are attracting attention. The byproducts account for approximately 20% of the RC juice extracts, but are mostly being discarded [5]. The hot water extract of RC byproducts contains 8.9% of organic acid, 69.9% of neutral sugar, 19.1% of pectin and 5.2% of anthocyanin [6].
Although studies on the polyphenol content [7] of RC byproducts using ethanol concentration have been reported, studies using RC byproducts have not been performed yet. Therefore, this study was conducted to investigate the effects of RC byproducts on intestinal microbes and the immune system in white rats. This may prove useful for the production of functional products using RC.

MATERIALS AND METHODS

Feed and experimental animal feeding experiment

The RC byproducts used in this experiment were obtained by generating a RC extract, drying the remaining byproducts (peel, seed) in a 50°C dry oven for 24 hours and then grinding them into a powder. Six-week-old male Sprague-Dawley rats were purchased from Samtako (Osan, Korea). A total of 6 rats were used in each treatment group, which were further divided into six repetitions consisting of one rat per repetition. The rats were subjected to a basal diet (AIN-76, Feed Lab, Guri, Korea) (Control group), a basal diet mixed with 0.5% dried RC byproduct powder (T1 group), a basal diet mixed with 1.0% dried RC byproduct powder (T2 group), and a basal diet mixed with 1.5% dried RC byproduct powder (T3 group). The animal housing was maintained at a temperature of 22°C ±3°C, relative humidity of 55%±5%, and light and dark cycles of 12 hours each. The rats underwent a 7-day acclimatization period before subjecting them to the aforementioned diets for 4 weeks, and the feed and drinking water were provided ad libitum. The weight and feed intake of each rat were measured once weekly throughout the experimental period. All procedures were approved by the Institutional Animal Care and Use Committees at Gyeongnam National University of Science and Technology (No. 2016–10).

DNA extraction and Illumina sequencing

All animals were sacrificed by diethyl ether and fecal samples of the rats were collected and stored at −80°C until genomic DNA (gDNA) extraction. DNA was extracted using Fecal DNA MiniPrep kits (Zymo Research, Irvine, CA, USA), and the sequence was analyzed using Illumina MiSeq (Chunlab Inc., Seoul, Korea) [8].

Quantitative polymerase chain reaction

As mentioned above, DNA was extracted from rat fecal samples. Quantitative polymerase chain reaction (qPCR) was performed using Rotor-Gene SYBR Green PCR Kits and Rotor-Gene Q (Qiagen, Hilden, Germany). The PCR cycling conditions were as follows: 40 cycles of 95°C for 10 s, 56°C for 30 s, 72°C for 10 s. Universal primer was used as the reference gene (Table 1).

Separation and analysis of RNA from rat spleen and mesenteric lymph nodes and RT-PCR

To analyze the immunomodulatory effects of the RC byproducts, rats were sacrificed and mesenteric lymph nodes (MLNs) and spleen were separated. Trizol was added to MLN and spleens and they were homogenized using SilentCrusher M (Heidolph, Schwabach, Germany). RNA was extracted and stored at −20°C until cDNA synthesis using reverse transcription-PCR (RT-PCR) kits (TaKaRa Co., Tokyo, Japan) according to the manufacturer’s instructions. RT-PCR (GeneAMP PCR System 9700; Thermo Fisher Scientific Inc., Waltham, MA, USA) cycling conditions are as follows: initial denaturation step at 50°C for 30 min, 94°C for 2 min, followed by 35 cycles of 94°C for 30 s, 55°C for 30 s, and 72°C for 59 s, and a final extension step at 72°C for 2 min. Glyceraldehyde-3-phosphate dehydrogenase was used as the reference gene (Table 2).

Statistical analysis

All results are shown as means±standard deviation and the variance of the results obtained through repeated experiments was analyzed using SPSS 12.0 (SPSS Inc., Chicago, IL, USA). The significance of the results was tested using Duncan’s multiple range test at a level of p<0.05.

RESULTS

Body weight, daily gain, daily feed intake and feed efficiency in rats

Rats in the T3 RC byproduct-fed group showed the greatest increase in both average daily gain and average daily feed intake (Table 3). The treatments with T1, T2, and T3 caused a marked feed efficiency when compared to the control group.

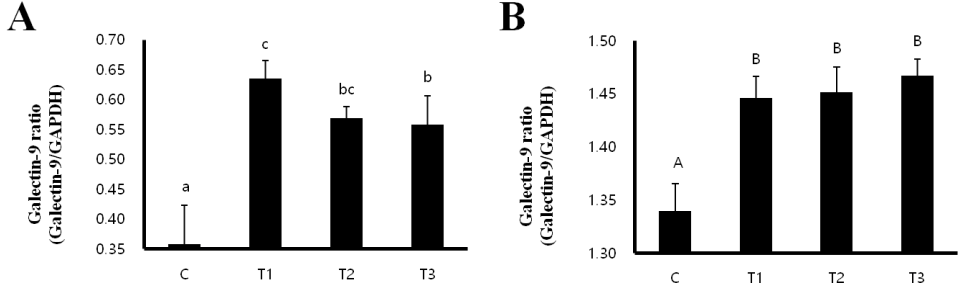
mRNA expression of galectin-9 in MLN and spleen

Galectin-9 is known to induce a Treg-mediated immune response [9]. We performed RT-PCR analysis to investigate whether RC byproducts can increase the mRNA expression of galectin-9 in MLNs and spleens of the rats. mRNA expression of galectin-9 was significantly increased in MLNs as well as spleens from the RC-treated (T1, T2, and T3) rats compared to that in the control group. In addition, the treatment with T1 caused the highest increase in the mRNA expression of galectin-9 in MLN (Figure 1).

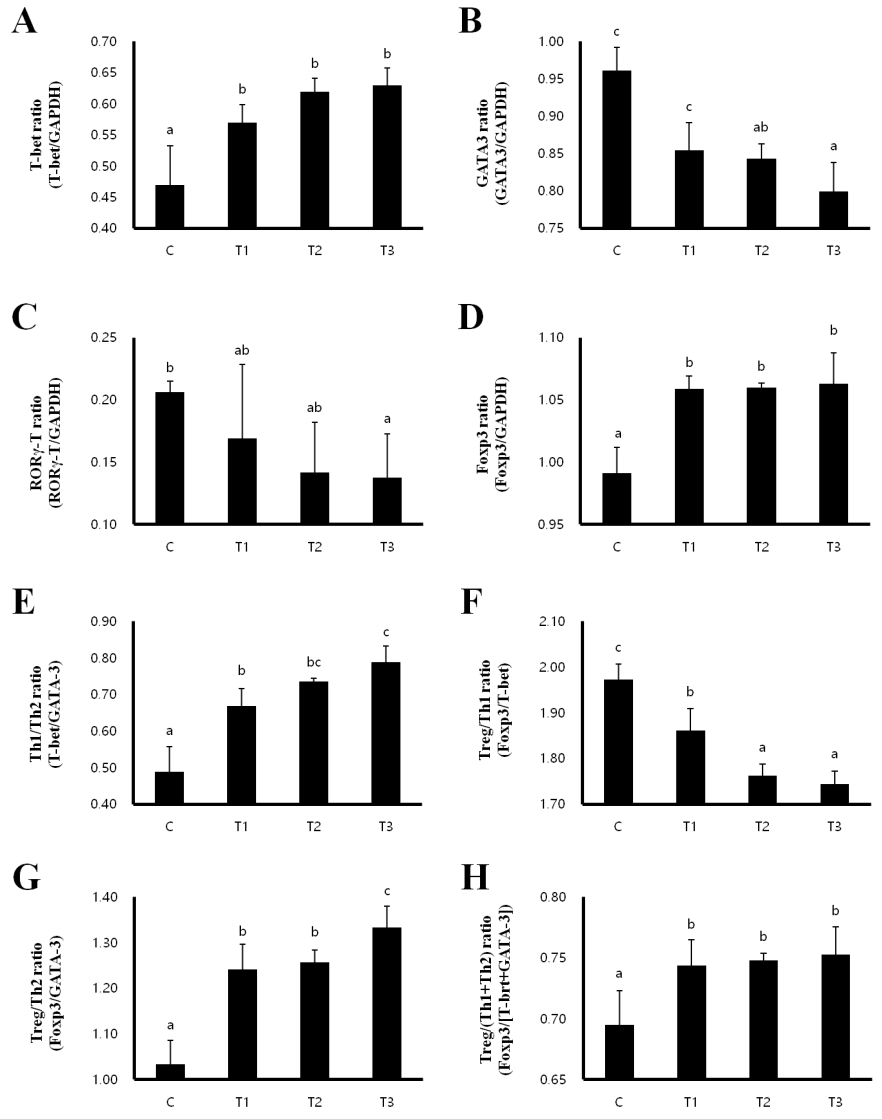
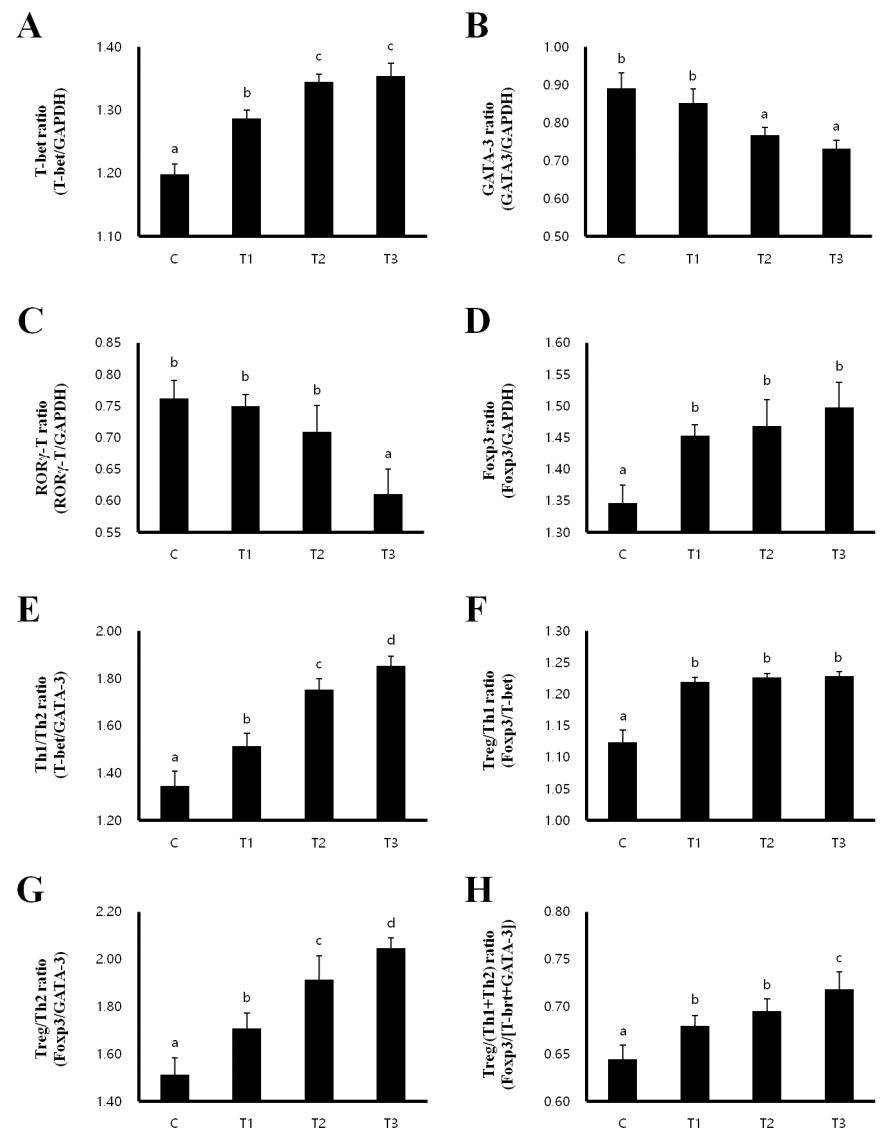
Th1/Th2 balance and the development of Treg cells in MLN and spleen

In order to investigate whether T cell polarization is influenced by RC, we evaluated the expression of the transcription factors T-box expressed in T cells (T-bet) for Th1, GATA binding protein 3 (GATA 3) for Th2, RAR-related orphan receptor gamma T (RORγT) for Th17 and forkhead box P3 (Foxp3) for Treg cells in the MLN and spleen. In the MLN, the expression of T-bet and Foxp3 were increased, while the expression of GATA-3 and RORγT were decreased in the T1, T2, and T3 treatment groups compared to that in the control group (Figures 2A–2D). Th1/Th2 and Treg/Th2 ratios were significantly increased in a dose-dependent manner in rats fed with T1, T2, and T3, inducing a Th1 and Treg cell-mediated immunity response (Figures 2E, 2G). However, the Treg/Th1 ratio was decreased and the Treg/(Th1+Th2) ratio was not changed (Figures 2E–2H). Consistent with the results in the MLN, T-bet and Foxp3 expression were increased in the T1, T2, and T3 treatment groups (Figures 3A, 3D), whereas GATA-3 and RORγT expression were decreased in the spleen compared to that in the control group (Figures 3B, 3C). The ratios of Th1/Th2 and Treg/Th1, and Treg/Th2 were increased to induce Th1 and Treg cell-mediated immunity (Figures 3E–3G). The ratio of Treg/(Th1+Th2) was also increased by T1, T2, and T3 treatment (Figure 3H). Therefore, these results indicate that RC byproducts can improve rat immunity by enhancing Treg cells in the MLN and spleen.

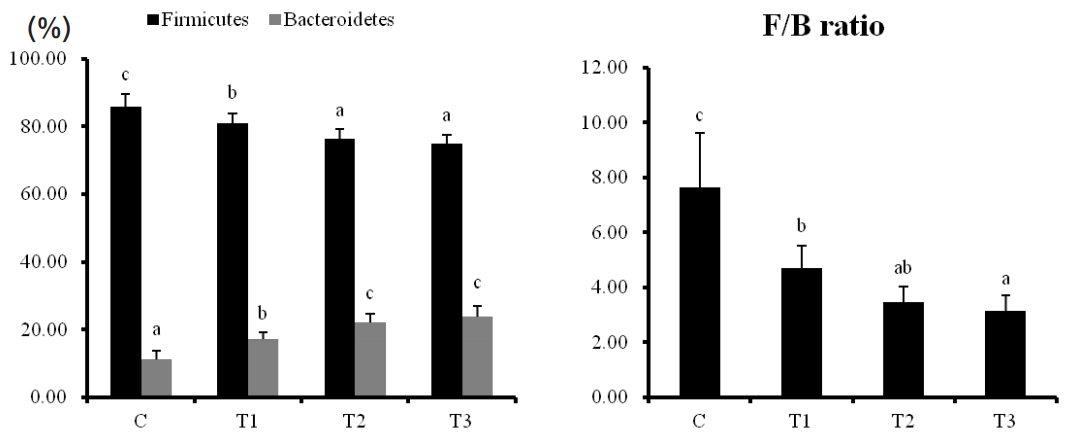
Intestinal microbiological environment in rats

When rats were supplied with T1, T2, and T3, Firmicutes (F) levels in the intestinal microflora were markedly decreased while Bacteroidetes (B) levels were increased in a dose-dependent manner (Figure 4). The F/B ratio was decreased depending on the concentration of T1, T2, and T3. Particularly, Clostridia from the phylum Firmicutes and pathogenic microorganisms belonging to the Peptococcaceae decreased by the consumption of T1, T2, and T3, and the non-pathogenic Lachnospiraceae and Ruminococcaceae microorganisms increased (Table 4). Among the class Bacteroidia, which occupies most of the Bacteroidetes, the number of microbes belonging to the non-pathogenic S24-7 and Rikenellaceae family increased. These results show that microorganisms promoting intestinal health were increased in rats fed with RC byproducts.

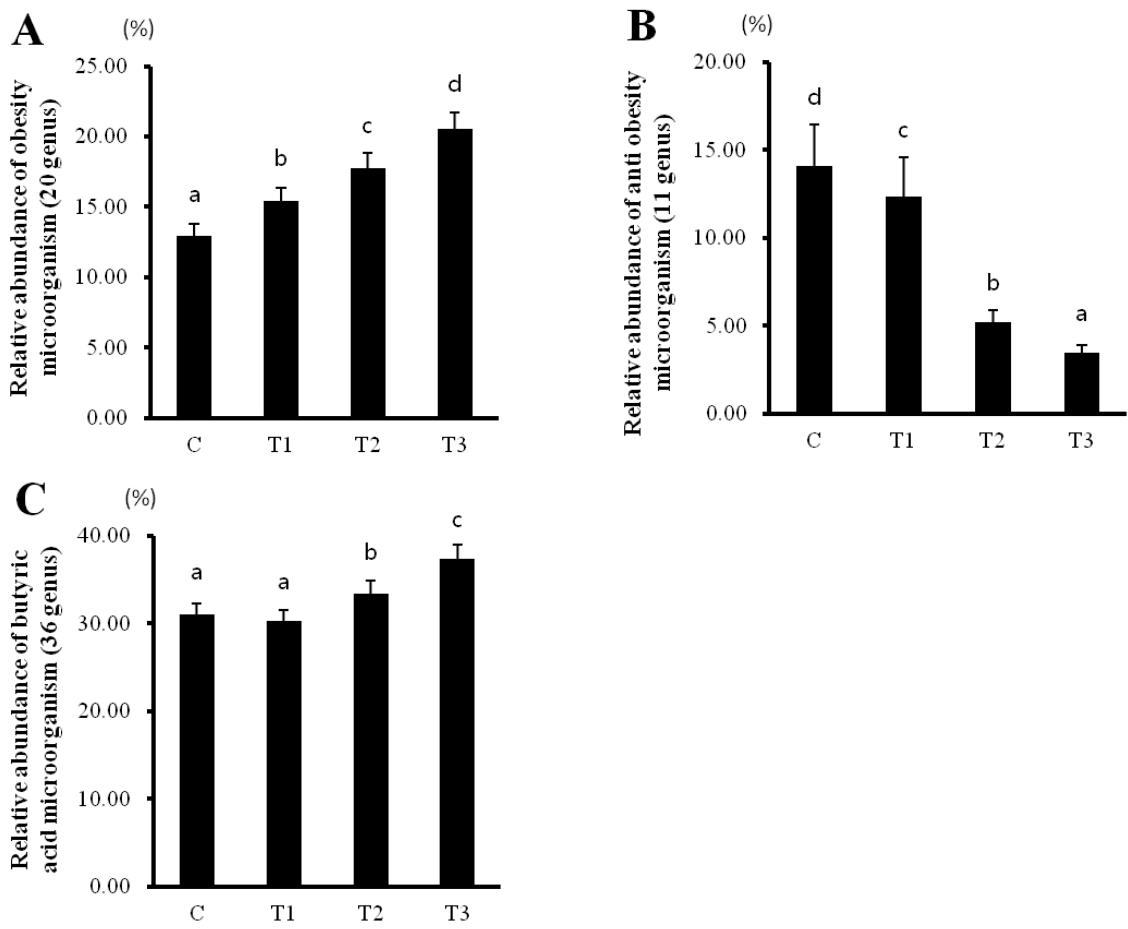
Microorganisms showing obesity, anti-obesity, and butyrate-producing traits

Rats fed with T1, T2, and T3 byproducts showed a decrease in anti-obesity microorganisms, while an increase in obesity- and butyrate-producing microorganisms occurred in a concentration-dependent manner (Figure 5). Therefore, these data suggest that RC byproducts can improve intestinal health by increasing the number of butyrate-producing microorganisms.

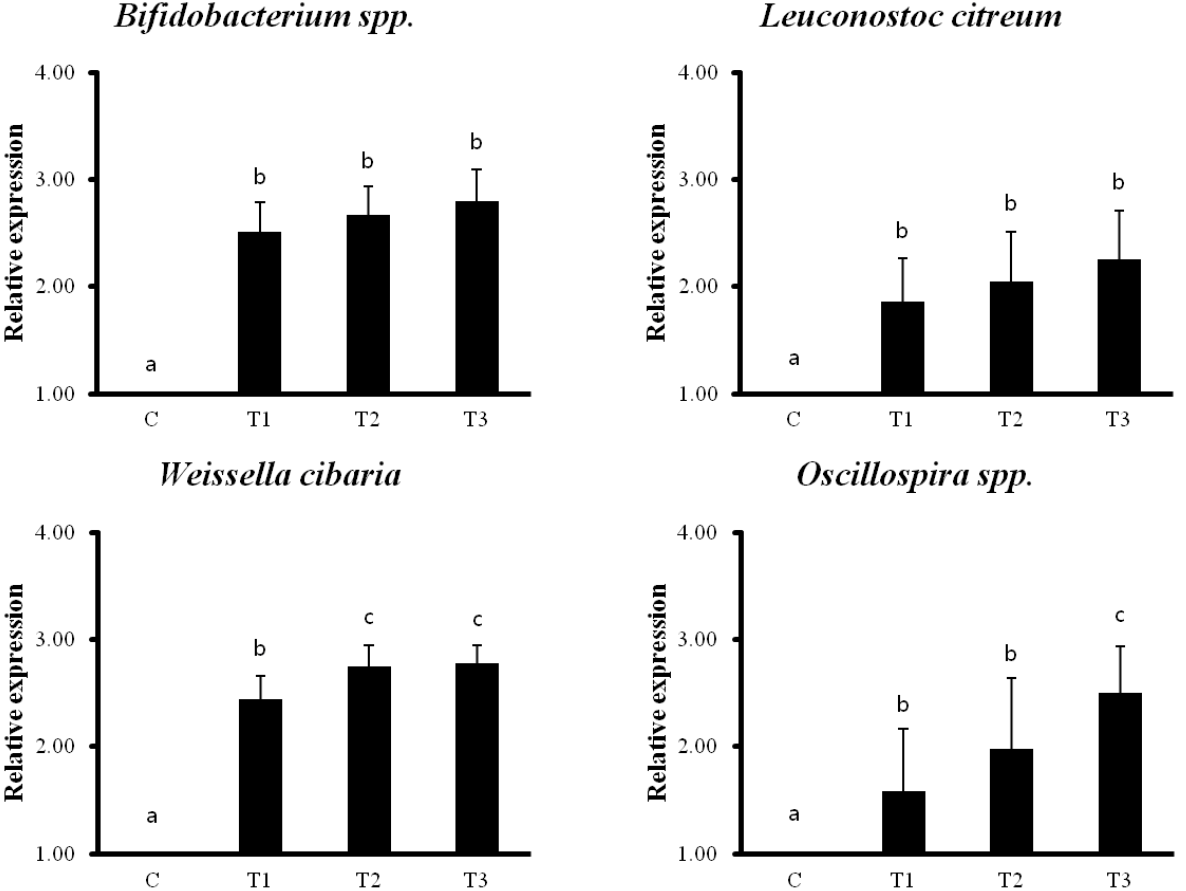
Intestinal lactic acid bacteria and intestinal microflora

The qPCR analysis showed that RC byproducts induced 12 intestinal probiotics and microorganisms compared to that in the control group. Particularly, Bifidobacterium spp., Leuconostoc citreum, Weissella cibaria, Oscillospira spp. showed the most prominent increase (Figure 6).

DISCUSSION

The RC byproducts account for approximately 20% of the bokbunja juice extract, but are mostly being discarded [5]. There have been some studies on the general components and polyphenol contents of RC byproducts [6,7]. To observe the effects of these byproducts on the intestinal microorganism environment and immune system of experimental animals, MLN and spleen mRNA was purified and analyzed for the composition of intestinal microorganisms via pyro-sequencing, and by investigating the mechanisms of immune function regulation. The expression of galectin-9 in the MLNs and spleens of rats fed 0.5%, 1.0%, and 1.5% RC was higher than that of the control group. This implies that RC byproducts can activate galectin-9 in the body. Previous studies have shown that galectin-9 induces Treg cell immune responses and neutralizes immunoglobulin E antibodies [10]. In addition, RC byproducts activated the mRNA expression of galectin-9 in the MLN and spleen with increased T-bet and Foxp3 as a reflection of Th1 and Treg cells, respectively. T-bet and Foxp3 could bind to multiple distal sites at immune regulatory genes for T cell fate determination as transcription factors [11]. This is consistent with the results of Kivit et al [12] who showed that galectin-9 induces Th1 and Treg cell development and increases interferon-γ and interleukin-10 secretion to suppress the allergic response and regulate immunity [12]. In addition, galectin-9, which induces apoptosis of T cells, inhibited the activation level of Treg/Th1 immune factors. Therefore, the RC byproducts activate the expression of galectin-9, and the activated galectin-9 promotes Th 1 and Treg immune responses and thus induces immunomodulation.
The mammalian intestinal microbiome is composed of hundreds of millions of microorganisms and could affect host metabolism and diseases such as obesity, arteriosclerosis, and type 2 diabetes. In addition to the host’s metabolism, these microbes also provide many advantages, including the development of the immune system and maintenance of the epithelial barrier [13]. Firmicutes and Bacteroidetes are the predominant phyla living in the intestine of humans and most mammals, and Proteobacteria, Actinobacteria, and Tenericutes together constitute other phyla [14]. Bacteroidetes [15], which contribute to defense against potential pathogens in the intestine, are increased by RC byproducts in the diet. The increase in Bacteroidetes is associated with a decrease in metabolic syndrome indicators such as high cholesterol and blood pressure [16]. Patients with type 1 diabetes or hypertension have increased intestinal levels of Firmicutes, which in turn increases the ratio of Firmicutes/Bacteroidetes [17]. Rats treated with RC byproducts showed a relative decrease of Firmicutes, and the ratio of Firmicutes/Bacteroidetes decreased in a concentration-dependent manner. The family Peptococcaceae in the Clostridia class consists of pathogenic microorganisms showing a positive correlation with CCL5, an inflammation-inducing cytokine, and decreased in response to RC treatment [18]. Lachnospiraceae and Ruminococcaceae of class Clostridia, the levels of which increase when RC byproducts are given, are microorganisms associated with metabolic health [19]. It is also known that RC produces intestinal anti-inflammatory compounds and butyrate which has immunomodulating properties [20]. The increased levels of microbes in the S24-7 family in the Bacteroidia class act as a protective factor for diabetes [21], while Rikenellaceae alter the intestinal environment and exhibit antitumor effects [22]. The decrease in pathogenic microorganisms and the increase in non-pathogenic microorganisms suggest that intestinal health is enhanced by RC byproducts in rats. The bioavailability of ellagitannins and ellagic acid in RC byproducts is very low. These molecules are converted by intestinal microorganisms to urolithin, which is much better absorbed in the body [23]. Urolithin production is more abundant in Firmicutes, especially in Clostridium leptum, than in Bacteroidetes [24]. Urolithin is a microflora metabolite of ellagic acid derivatives [25], which enhances anti-proliferative, anti-inflammatory, and vascular endothelial function in cancer cell models [26]. Dietary fibers, such as RC byproducts, are fermented by microorganisms in the large intestine to produce short-chain fatty acids containing butyric acid [27]. Butyrate-producing microorganisms belong to the Firmicutes, and among them, Ruminococcus, Roseburia, and Eubacterium are prominent examples [28]. Bifidobacterium spp. is an important microorganism with immunomodulatory and anticancer activity [29], and its levels increased when bifidobacterial byproducts were ingested. In rats fed with RC byproducts, levels of butyrate-producing microorganisms increased, leading to improved intestinal health. In conclusion, the consumption of RC byproducts increased the expression of Th1 and Treg cell transcription factors and galectin-9 in this study. In addition, the intestinal environment was changed by decreasing Firmicutes, increasing Bacteroidetes, and decreasing the Firmicutes/Bacteroidetes ratio. This suggests that bokbunja byproducts improve immune function and promote bowel health.

Notes

CONFLICT OF INTEREST

We certify that there is no conflict of interest with any financial organization regarding the material discussed in the manuscript. Park HC, Jung JH are employees of Dasan Genetics, and Shin DK is employee of Berry & Biofood Research Institute.

ACKNOWLEDGMENTS

This research was supported by the Economic Cooperation Industrial Development Project (No. R0005730), Ministry of Trade, Industry, and Energy, Korea.

Figure 1
Rat fed Rubus coreanus byproducts show enhanced galectin-9 development in mesenteric lymph nodes (MLN) and spleen. C, control; T1, 0.5% Rubus coreanus byproducts; T2, 1.0% Rubus coreanus byproducts; T3, 1.5% Rubus coreanus byproducts. The expression of galectin-9 in MLN was higher in the group fed with Rubus coreanus byproducts than in control, and highest in the group of 0.5% Rubus coreanus byproducts. Galectin-9 expression in the spleen was also higher in the group fed with Rubus coreanus byproducts than in control. a-c Means are significantly different within the same row (p<0.05). Data represent means±standard deviation of 6 replicates.
ajas-31-3-429f1.gif
Figure 2
Rat fed Rubus coreanus byproducts show enhanced Treg-cell development in mesenteric lymph nodes (MLN). C, control; T1, 0.5% Rubus coreanus byproducts; T2, 1.0% Rubus coreanus byproducts; T3, 1.5% Rubus coreanus byproducts. T-cell polarization in MLN was evaluated by analyzing the expression of T-bet (Th1, A), GATA binding protein 3 (GATA-3) (Th2, B), RAR-related orphan receptor gamma T (RORγT) (Th17, C) and forkhead box P3 (Foxp3) (Treg, D). The expression of Foxp3 tended to increase in rat fed Rubus coreanus byproducts, while GATA-3 and RORγT expression was decreased. Expression of T-bet was no changed. Rat fed Rubus coreanus byproducts showed an increased Th1/Th2 (E) and Treg/Th2 ratio (F), but the Treg/Th1 ratio decreased (G). The ratio between Treg cells and effector Th1 and Th2 cells (H) was no changed. a–c Means are significantly different within the same row (p<0.05). Data represent means±standard deviation of 6 replicates.
ajas-31-3-429f2.gif
Figure 3
Rat fed Rubus coreanus byproducts show enhanced Treg-cell development in spleen. C, Control; T1, 0.5% Rubus coreanus byproducts; T2, 1.0% Rubus coreanus byproducts; T3, 1.5% Rubus coreanus byproducts. T-cell polarization in spleen was evaluated by analyzing the expression of T-box expressed in T cells (T-bet) (Th1, A), GATA binding protein 3 (GATA-3) (Th2, B), RAR-related orphan receptor gamma T (RORγT) (Th17, C) and forkhead box P3 (Foxp3) (Treg, D). The expression of Foxp3 tended to increased in rat fed Rubus coreanus byproducts, while GATA-3 and RORγT expression was decreased. Expression of T-bet was no changed. Rat fed Rubus coreanus byproducts showed an increased Th1/Th2 (E) and Treg/Th2 ratio (F), but the Treg/Th1 ratio decreased (G). The ratio between Treg cells and effector Th1 and Th2 cells (H) was increased. a–c Means are significantly different within the same row (p<0.05). Data represent means±standard deviation of 6 replicates.
ajas-31-3-429f3.gif
Figure 4
Effects of dietary supplementation of Rubus coreanus byproducts on diversity of phyla of Intestinal microbiota in rats. C, control; T1, 0.5% Rubus coreanus byproducts; T2, 1.0% Rubus coreanus byproducts; T3, 1.5% Rubus coreanus byproducts. Duncan’s multiple range test was used to show the Firmicutes and Bacteroidetes contents and F/B ratios of each sample at the phylum level. F/B ratio was reduced by Rubus coreanus byproducts. a–c Means are significantly different within the same row (p<0.05). Data represent means±standard deviation of 6 replicates.
ajas-31-3-429f4.gif
Figure 5
Rat fed Rubus coreanus byproducts show relatively changed intestinal microorganisms. C, control; T1, 0.5% Rubus coreanus byproducts; T2, 1.0% Rubus coreanus byproducts; T3, 1.5% Rubus coreanus byproducts. The relative abundance of obesity microorganism (Roseburia, Eubacterium_g8, Pseudoflavonifractor, Ruminococcaceae_uc, Ruminococcus, JN713389_g, Eubacterium_g23, AB185816_g, Caproiciproducens, Ruminococcus_g2, JQ084194_g, Subdoligranulum, Oscillibacter, Butyricicoccus, EF602946_g, Allobaculum, Erysipelotrichaceae_uc, Coprobacillus, Faecalibaculum, EF445272_g; (A) and antiobesity microorganism (Bacteroides, Parabacteroides, Prevotella, Prevotellaceae_uc, Alistipes, AB239481_g, Christensenellaceae_uc, HM124260_g, GU302849_g, Christensenella, Bacteroides_g1; (B) tended to increase in rat fed Rubus coreanus byproducts, while butyric acid microorganism (Eubacterium_g17, Eubacterium_g4, Roseburia, Eubacterium_g6, Eubacterium_g20, Eubacterium_g21, Eubacterium_g8, Pseudoflavonifractor, Ruminococcaceae_uc, Ruminococcus, JN713389_g, Eubacterium_g23, AB185816_g, Caproiciproducens, Ruminococcus_g2, JQ084194_g, Subdoligranulum, Oscillibacter, Anaerotruncus, Butyricicoccus, EF602946_g, Phascolarctobacterium, Clostridium_g21, AB606237_g, FJ880395_g, Blautia, JPZU_g, AJ576336_g, AB606254_g, HM123979_g, Coprococcus_g2, Ruminococcus_g4, GU324393_g, Murimonas, EU509117_g, Marvinbryantia; (C) relative abundance was decreased. Data represent means±standard deviation of 6 replicates.
ajas-31-3-429f5.gif
Figure 6
Rat fed Rubus coreanus byproducts show increased intestinal lactobacilli and microorganisms by quantitative polymerase chain reaction (qPCR). C, control; T1, 0.5% Rubus coreanus byproducts; T2, 1.0% Rubus coreanus byproducts; T3, 1.5% Rubus coreanus byproducts. The expression of Bifidobacterium spp., Leuconostoc citreum, Weissella cibaria and Oscillospira spp. tended to increased in rat fed Rubus coreanus byproducts. a–c Means are significantly different within the same row (p<0.05). Data represent means±standard deviation of 6 replicates.
ajas-31-3-429f6.gif
Table 1
Quantitative real-time polymerase chain reaction primer design
Target group/specificity Primer sequence
Universal Forward GTGSTGCAYGGYYGTCGTCA
Reverse ACGTCRTCCMCNCCTTCCTC
Bacteroides spp. Forward GAAGGTCCCCCACATTG
Reverse CGCKACTTGGCTGGTTCAG
Roseburia spp. and E. rectale Forward GCGGTRCGGCAAGTCTGA
Reverse CCTCCGACACTCTAGTMCGAC
Faecalibacterium prausnitzii Forward GGAGGAAGAAGGTCTTCGG
Reverse AATTCCGCCTACCTCTGCACT
Cluster IV Ruminococcus spp. Forward GGCGGCYTRCTGGGCTTT
Reverse CCAGGTGGATWACTTATTGTGTTAA
Bifidobacterium spp. Forward TCGCGTCYGGTGTGAAAG
Reverse GGTGTTCTTCCCGATATCTACA
Methanogens Forward GGATTAGATACCCSGGTAGT
Reverse GTTGARTCCAATTAAACCGCA
Oscillospira spp. Forward ACGGTACCCCTTGAATAAGCC
Reverse TCCCCGCACACCTAGTATTG
Leuconostoc mesenteroid Forward TGATGCATAGCCGAGTTGAG
Reverse GAAAGCCTTCATCACACACG
Leuconostoc citreum Forward GGAAACAGATGCTAATACCGAATA
Reverse TTTACCCCACCAACTAACTAATG
Weissella cibaria Forward GGGAAACCTACCTCTTAGCA
Reverse GGACCATCTCTTAGTGATAGCA
Weissella koreensis Forward GGGCTACACACGTGCTACAA
Reverse GATTCCGACTTCGTGTAGGC
Lactobacillus sakei Forward CCATGTGTAGCGGTGAAATG
Reverse ATCCTGTTTGCTACCCATGC
Table 2
Reverse transcriptase polymerase chain reaction primer design
Target group/specificity Primer sequence
TGF-β Forward GAAGGCAGAGTTCAGGGTCTT
Reverse GGTTCCTGTCTTTGTGGTGAA
IL-10 Forward ATAACTGCACCCACTTCCCA
Reverse TCATTTCCGATAAGGCTTGG
IFN-γ Forward TCAAGTGGCATAGATGTGGAAGAA
Reverse TGGCTCTGCAGGATTTTCATG
IL-17A Forward TTCATCTGTGTCTCTGATGCT
Reverse TTGACCTTCACATTCTGGAG
IL-4 Forward ACAGGAGAAGGGACGCCAT
Reverse GAAGCCCTACAGACGAGCTCA
Foxp3 Forward CCCATCCCCAGGAGTCTTG
Reverse CCATGACTAGGGGCACTGTA
GATA3 Forward CATTACCACCTATCCGCCCTATG
Reverse CACACACTCCCTGCCTTCTGT
T-bet Forward TCAACCAGCACCAGACAGAG
Reverse AAACATCCTGTAATGGCTTGTG
RORγt Forward TTCACCCCACCTCCACTG
Reverse TGCAAGGGATCACTTCAATTT

TGF-β, transforming growth factor beta; IL-10, interleukin-10; IFN-γ, interferon-γ; Foxp3, forkhead box P3; GATA3, GATA binding protein 3; T-bet, T-box expressed in T cells; RORγt, Rar-related orphan receptor gamma T.

Table 3
Rat fed Rubus coreanus byproducts weight gain, daily feed intake, and feed efficiency
C1) T1 T2 T3
Initial body weight (g) 220.34±0.53 220.05±0.79 220.21±0.48 219.90±0.70
Finished body weight (g) 308.45±0.17a 307.38±0.22a 308.18±0.88a 311.35±0.97b
Average daily gain (g) 3.15±0.02a 3.12±0.02a 3.14±0.04a 3.27±0.04b
Average daily feed intake (g) 20.49±0.68c 17.93±0.39a 18.67±0.19b 19.19±0.40b
Feed efficiency 0.15±0.005a 0.17±0.004b 0.17±0.003b 0.17±0.003b

SD, standard deviation; ADG, average daily gain; ADFI, average daily feed intake.

Data represent means±standard deviation of 6 replicates.

1) C, control; T1, 0.5% Rubus coreanus byproducts; T2, 1.0% Rubus coreanus byproducts; T3, 1.5% Rubus coreanus byproducts.

ADG, ADFI and feed efficiency increased when Rubus coreanus byproducts were fed as compared to control.

a–c Means are significantly different within the same row (p<0.05).

Table 4
The mean of the relative abundance of dominant phyla, classes and familia in fecal sample obtained from rat
Items2) Treatments1)

C T1 T2 T3

n = 6 mean% (SD) n = 6 mean% (SD) n = 6 mean% (SD) n = 6 mean% (SD)
Firmicutes 85.79 (3.68)c 80.90 (2.97)b 76.45 (2.77)a 74.96 (2.56)a
Clostridia 68.49 (3.19)b 65.01 (1.71)a 63.13 (2.80)a 65.05 (2.08)a
  Lachnospiraceae 39.74 (2.21)a 40.50 (2.78)a 42.10 (2.16)ab 44.93 (2.24)b
  Ruminococcaceae 19.32 (4.18) 19.84 (2.06) 19.59 (2.80) 18.40 (1.78)
  Peptococcaceae 3.19 (0.19)c 1.31 (0.15)b 0.16 (0.07)a 0.13 (0.04)a
Bacilli 15.86 (2.04)c 13.11 (1.80)b 10.95 (1.23)a 8.90 (1.96)a
  Lactobacillaceae 15.37 (2.81)c 12.71 (2.76)bc 10.50 (2.92)ab 8.60 (1.41)a
Bacteroidetes 11.23 (2.50)a 17.14 (2.05)b 21.95 (2.76)c 23.77 (3.07)c
Bacteroidia 10.84 (1.25)a 16.82 (2.50)b 21.74 (1.91)c 23.38 (1.98)c
  S24-7_f 7.33 (1.02)a 8.98 (1.71)a 11.32 (2.17)b 14.95 (1.59)c
  Prevotellaceae 1.28 (0.74)a 6.08 (1.90)c 6.68 (1.77)c 3.40 (1.00)b
  Rikenellaceae 1.68 (0.57)a 1.16 (0.52)a 2.88 (1.48)b 4.29 (1.08)c

SD, standard deviation.

Data represent means±SD of 6 replicates.

1) C, control; T1, 0.5% Rubus coreanus byproducts; T2, 1.0% Rubus coreanus byproducts; T3, 1.5% Rubus coreanus byproducts.

2) Statistical tests of over-or under-representation of bacterial lineages among at each sample were made at the phylum (bold), class (bold) and family levels using Duncan's multiple range test. Rat fed Rubus coreanus byproducts show Firmicutes decreased and Bacteroidetes increased.

a–c Means are significantly different within the same row (p<0.05).

REFERENCES

1. Jang YD, Oh HK, Piao LG, et al. Evaluation of probiotics as an alternative to antibiotic on growth performance, nutrient digestibility, occurrence of diarrhea and immune response in weaning pigs. Anim Feed Sci Technol 2009; 51:25–32.
crossref
2. Sung KC. A Study on the pharmaceutical and chemical characteristics and analysis of natural Bokbunja extract. J Korean Oil Chem Soc 2012; 29:402–11.

3. Jang TS, Yang JC, Lim SY, Kim BA. Antioxidant and antihemolytic activity of ethanol extracts of Rubus coreanus Miquel. J Korean Oil Chem Soc 2014; 31:130–5.
crossref
4. Espín JC, Larrosa M, García-Conesa MT, Tomás-Barberán F. Biological significance of urolithins, the gut microbial ellagic acid-derived metabolites: the evidence so far. Evid Based Complement Alternat Med 2013; 2013:Article ID 270418
crossref pdf
5. Ku CS, Mun SP. Optimization of the extraction of anthocyanin from Bokbunja (Rubus coreanus Miq.) marc produced during traditional wine processing and characterization of the extracts. Bioresour Technol 2008; 99:8325–30.
crossref pmid
6. Ku CS, Mun SP. Antioxidant activities of ethanol extracts from seeds in fresh Bokbunja (Rubus coranus Miq.) and wine processing waste. Bioresour Technol 2008; 99:4503–9.
crossref pmid
7. Jeong YJ, Seo JH. Conditions for pigment extraction from Bokbunja (Rubus coreanus Miquel) byproducts. Korean J Food Preserv 2009; 16:400–4.

8. Jeon YS, Park SC, Lim J, Chun J, Kim BS. Improved pipeline for reducing erroneous identification by 16S rRNA sequences using the Illumina MiSeq platform. J Microbiol 2015; 53:60–9.
crossref pmid
9. Rabinovich GA, Toscano MA. Turning ‘sweet’ on immunity: galectin-glycan interactions in immune tolerance and inflammation. Nat Rev Immunol 2009; 9:338–52.
crossref pmid pdf
10. Niki T, Tsutsui S, Hirose S, et al. Galectin-9 is a high affinity IgE-binding lectin with anti-allergic effect by blocking IgE-antigen complex formation. J Biol Chem 2009; 284:32344–52.
crossref pmid pmc
11. Kanhere A, Hertweck A, Bhatia U, et al. T-bet and GATA3 orchestrate Th1 and Th2 differentiation through lineage-specific targeting of distal regulatory elements. Nat Commun 2012; 3:1268
crossref pmid pmc pdf
12. de Kivit S, Saeland E, Kraneveld AD, et al. Galectin-9 induced by dietary synbiotics is involved in suppression of allergic symptoms in mice and humans. Allergy 2012; 67:343–52.
crossref pmid
13. Wells JM, Rossi O, Meijerink M, van Baarlen P. Epithelial crosstalk at the microbiota-mucosal interface. Proc Natl Acad Sci USA 2011; 108:Suppl 14607–14.
crossref pmid
14. Yang T, Owen JL, Lightfoot YL, Kladde MP, Mohamadzadeh M. Microbiota impact on the epigenetic regulation of colorectal cancer. Trends Mole Med 2013; 19:714–25.
crossref
15. Wexler HM. Bacteroides: the good, the bad, and the nitty-gritty. Clin Microbiol Rev 2007; 20:593–621.
crossref pmid pmc
16. Henning SM, Yang J, Shao P, et al. Health benefit of vegetable/fruit juice-based diet: Role of microbiome. J Sci Rep 2017; 7:2167
crossref
17. Pellegrini S, Sordi V, Bolla AM, et al. Duodenal mucosa of patients with type 1 diabetes shows distinctive inflammatory profile and microbiota. J Clin Endocrinol Metab 2017; 102:1468–77.
crossref pmid pdf
18. Houlden A, Goldrick M, Brough D, et al. Brain injury induces specific changes in the caecal microbiota of mice via altered autonomic activity and mucoprotein production. Brain Behav Immun 2016; 57:10–20.
crossref pmid pmc
19. Morowitz MJ, Di Caro V, Pang D, et al. Dietary supplementation with nonfermentable fiber alters the gut microbiota and confers protection in murine models of sepsis. Crit Care Med 2017; 45:e516–e523.
crossref pmid pmc
20. Aktas B, De Wolfe TJ, Tandee K, et al. The effect of Lactobacillus casei 32G on the mouse cecum microbiota and innate immune response is dose and time dependent. PLOS ONE 2015; 10:e0145784
crossref pmid pmc
21. Krych Ł, Nielsen DS, Hansen AK, Hansen CH. Gut microbial markers are associated with diabetes onset, regulatory imbalance, and IFN-γ level in NOD mice. Gut Microbes 2015; 6:101–9.
crossref pmid pmc
22. Wu M, Wu Y, Deng B, et al. Isoliquiritigenin decreases the incidence of colitis-associated colorectal cancer by modulating the intestinal microbiota. Oncotarget 2016; 7:85318–31.
crossref pmid pmc
23. Espín JC, Larrosa M, García-Conesa MT, Tomás-Barberán F. Biological significance of urolithins, the gut microbial ellagic acid-derived metabolites: the evidence so far. Evid Based Complement Alternat Med 2013; 2013:Article ID 270418
crossref pdf
24. García-Villalba R, Beltrán D, Espín JC, Selma MV, Tomás-Barberán FA. Time course production of urolithins from ellagic acid by human gut microbiota. J Agric Food Chem 2013; 61:8797–806.
crossref pmid
25. Tang L, Mo Y, Li Y, et al. Urolithin A alleviates myocardial ischemia/reperfusion injury via PI3K/Akt pathway. Biochem Biophys Res Commun 2017; 486:774–80.
crossref pmid
26. Selma MV, González-Sarrías A, Salas-Salvadó J, et al. The gut microbiota metabolism of pomegranate or walnut ellagitannins yields two urolithin-metabotypes that correlate with cardiometabolic risk biomarkers: Comparison between normoweight, overweight-obesity and metabolic syndrome. Clin Nutr 2017; S0261–5614. 1730103–6.
crossref
27. Duncan SH, Louis P, Flint HJ. Lactate-utilizing bacteria, isolated from human feces, that produce butyrate as a major fermentation product. Appl Environ Microbiol 2004; 70:5810–7.
crossref pmid pmc
28. Wu M, Wu Y, Deng B, et al. Isoliquiritigenin decreases the incidence of colitis-associated colorectal cancer by modulating the intestinal microbiota. Oncotarget 2016; 7:85318–31.
crossref pmid pmc
29. Vuotto C, Longo F, Donelli G. Probiotics to counteract biofilm-associated infections: promising and conflicting data. Int J Oral Sci 2014; 6:189–94.
crossref pmid pmc pdf


Editorial Office
Asian-Australasian Association of Animal Production Societies(AAAP)
Room 708 Sammo Sporex, 23, Sillim-ro 59-gil, Gwanak-gu, Seoul 08776, Korea   
TEL : +82-2-888-6558    FAX : +82-2-888-6559   
E-mail : editor@animbiosci.org               

Copyright © 2024 by Asian-Australasian Association of Animal Production Societies.

Developed in M2PI

Close layer
prev next