


INTRODUCTION
miRNAs are short non-coding RNAs that are approximately 20 to 25 nucleotides long and have a regulatory role in eukaryotes [1]. Currently, most known miRNAs function by inhibiting mRNA translation and degrading mRNA. Mature miRNAs assemble into the RNA-induced silencing complex, which targets mRNA through complementary base pairing to regulate target genes by targeting mRNA degradation or repressing mRNA translation of target genes [2]. miRNAs participate in the regulation of a variety of functions, including gene expression, developmental timing, organ development, cell proliferation, cell apoptosis, cell differentiation, fat metabolism, the nervous system, and tumor biological processes [3,4].
miR-375 is a small non-coding RNA fragment that is transcribed from the fragments of two genes, coiled-coil domain-containing protein 108-like and crystallin beta A2, in human chromosome 2. The mature miR-375 sequence is UUUGUUCGUUCGGCUCGCGUGA. The conserved sequence of miR-375 in different species is CUUGUUU. The aim of this study was to find a possible target gene of miR-375 that matches the GAACAAA sequence. In 2012, it was concluded that expression of miR-375 is significantly different between the mature and immature boar testis by Solexa deep sequencing [5] and it was hypothesized that miR-375 has an impact on boar reproduction. Previous studies have reported that miR-375 is a key factor that regulates E2 synthesis by mediating the corticotropin releasing hormone (CRH) signaling pathway to control the function of the animal reproductive system [6]. In bovine CCs, over-expression of miR-375 attenuated the proliferation ability and significantly increased the apoptosis rate of bovine CCs, whereas inhibition of miR-375 did not significantly change the proliferation ability or apoptosis rate. Based on the importance of ST cells and miR-375 functional analysis, it was speculated that miR-375 might play a role in the proliferation of ST cells.
Hypoxia-induced gene domain protein-1a (HIGD1A) is referred to as hypoglycemia/hypoxia inducible mitochondrial protein1-a or hypoxia induced gene 1 and is a 10.4-kDa mitochondrial inner membrane protein [7]. Although Higd-1a is induced by hypoxia and promotes survival, its modes of action have not been defined. We showed that Higd-1a–transfected cells undergo significantly less apoptosis as the result of inhibition of the release of cytochrome c and reduction of caspase activity [8]. Reports have shown that Higd-1a depletion results in mitochondrial fission, depletion of mtDNA, disorganization of cristae, and growth retardation [9]. In addition, HIGD1A decreases tumor growth, but promotes tumor cell survival in vivo [10].
Rearranged L-myc fusion (RLF) is a protein coding gene. Diseases associated with RLF include left ventricular noncompaction. Zinc finger protein 292 is an important paralog of this gene. RLF is widely expressed in fetal and adult tissues, suggesting that it has a general role in transcriptional regulation [11]. Therefore, the relationship between miR-375 and its target genes can be verified and its effects on ST cell proliferation can be explored.
Therefore, it was hypothesized that miR-375 may regulate cell proliferation by regulating its target genes, thereby affecting animal reproduction. This study aimed to screen and identify the target genes of miR-375 in pig ST cells and to elucidate the effect of miR-375 on the proliferation of ST cells.
MATERIALS AND METHODS
Bioinformatics prediction of target genes
We found the miR-375 conservative sequence in miRBase (http://www.mirbase.org/) and determined the target genes of miR-375 by matching sequences from miRBase with the GAACAAA sequence. TargtScan (http://www.targetscan.org/vert_70/) was used to search for genes with the GAACAAA sequence. Then, the functions of the genes were analyzed by gene ontology.
Cells culture
Pig Sertoli (ST) cells were purchased from the Boster Biological Technology Company. ST cells were cultured in HIGH GLUCOSE (GIBCO, USA) with 10% fetal bovine serum (FBS; Gibco, Austria) and 1% penicillin-streptomycin (HyClone, USA) in an incubator at 37°C and 5% CO2. A transfection plasmid was inserted using FuGENE HD (Roche, Switzerland) according to the manufacturer’s instructions. Twenty-four hours after transfection, the cell morphology and expression level of the red fluorescent protein was observed under a fluorescence microscope (NikonTE2000, Japan).
Plasmid
The miR-375 mimic, miRNA-375 inhibitor and negative control mimic (NC) plasmids were purchased from the GenePharma Company in China. The sequences of the RLF and HIGD1A genes were amplified via PCR with NotI and XhoI restriction sites and then cloned into the pmiR-RB-REPORT vector to create the recombinant vectors pmiR-RB-REPORT-RLF-WT and pmiR-RB-REPORT-HIGD1A-WT.
The dual luciferase reporter gene primer sequence of RLF:
The dual luciferase reporter gene primer sequence of HIGD1A:
The pmiR-RB-REPORT-RLF-MUT and pmiR-RB-REPORT-HIGD1A-MUT were purchased from the GENEWIZ Company in China. The recognition sequence of the miR-375 CGAACAA site was mutated to a non-recognition sequence, CATGTAGC, in the plasmid.
RNA extraction and real-time quantitative polymerase chain reaction
ST cells transfected with the miR-375 mimics, miR-375 inhibitor and miRNA-ShNC were harvested at 24 h post-transfection. The reverse transcription primers and fluorescence-labeled primers for quantitative analysis of miR-375 and its target genes were designed using Primer 5.0. All of the primers were synthesized by Shanghai Sangon (Table 1). Total RNA was extracted using the innuPREP RNA Mini Kit (Analytikjena, Germany) according to the manufacturer’s protocols. Based on the quality and concentration of RNA, cDNA was reversed transcribed with the PrimeScript RT Reagent Kit (Takara, Dalian, China) according to the manufacturer’s instructions. Quantitative polymerase chain reaction (qPCR) was performed using a SYBR Premix Ex Taq (TaKaRa, Japan) on a stratagene Mx3005P (Agilent, USA) according to the instructions. The qPCR volume was 20 μL. The relative mRNA levels of miR-375, RLF, HIGD1A, colorectal cancer associated 2 (COLCA2), POU class 3 homeobox 1 (POU3F1), and WW domain binding protein 1 like (WBP1L) were normalized to U6 and β-actin. The data were analyzed using the SPSS 19.0 software, and the fold change of expression was calculated using the 2−ΔΔCT method according to the following formula:
Here, 2−ΔΔCT refers to the relative expression ratio.
Protein extraction and ELISA analysis
Total protein was extracted from cells transfected with the miR-375 mimics, miR-375 inhibitor and miRNA-ShNC using RIPA buffer (Boster, Wuhan, China) according to the manufacturer’s instructions. The protein concentration was determined by a BCA Protein Assay Kit (keyGEN BioTECH, China). Then, the protein was tested by an ELISA kit (Unionhonest) according to the instructions.
Luciferase assays
ST cells were plated on 24-well plates for 24 h before transfection. miR-375 mimics plasmids (1 μg) containing the RLF-WT (1 μg), HIGD1A-WT (1 μg), RLF-MUT (1 μg), HIGD1A-MUT (1 μg) genes or luciferase vector (pmiR-RB-Report) (1 μg) were co-transfected with 2 μL of FuGENE HD (Roche, Switzerland) in triplicate for 36 h. The luciferase activities were detected using a SpectraMax M5 Microplate Reader (Molecular Devices, USA). The luciferase activities were expressed as the activity ratio of Renilla/luciferase.
Cell proliferation assay
Proliferation was examined using the 96 AQueous One Solution Reagent (Promega, Beijing, China) according to the manufacturer’s instructions. Then, 100 μL cell suspensions (500 cells) were added to each well in a 96-well plate. After 12 hours, the miR-375 mimics, miR-375 inhibitor and miRNA-ShNC were transfected with FuGENE HD Transfection Reagent. Then, 20 μL of MTS (CellTiter 96 AQueous One Solution Cell Proliferation Assay) Reagent was added to each well and the absorbance values at 490 nm were recorded 0 h, 6 h, 12 h, and 24 h after transfection using a multiwall spectrophotometer. Each group was subjected to 3 Biological repeats, and the mean values were obtained.
RESULTS
RLF, HIGD1A, COLCA2, POU3F1, and WBP1L might be the target gene of miR-375
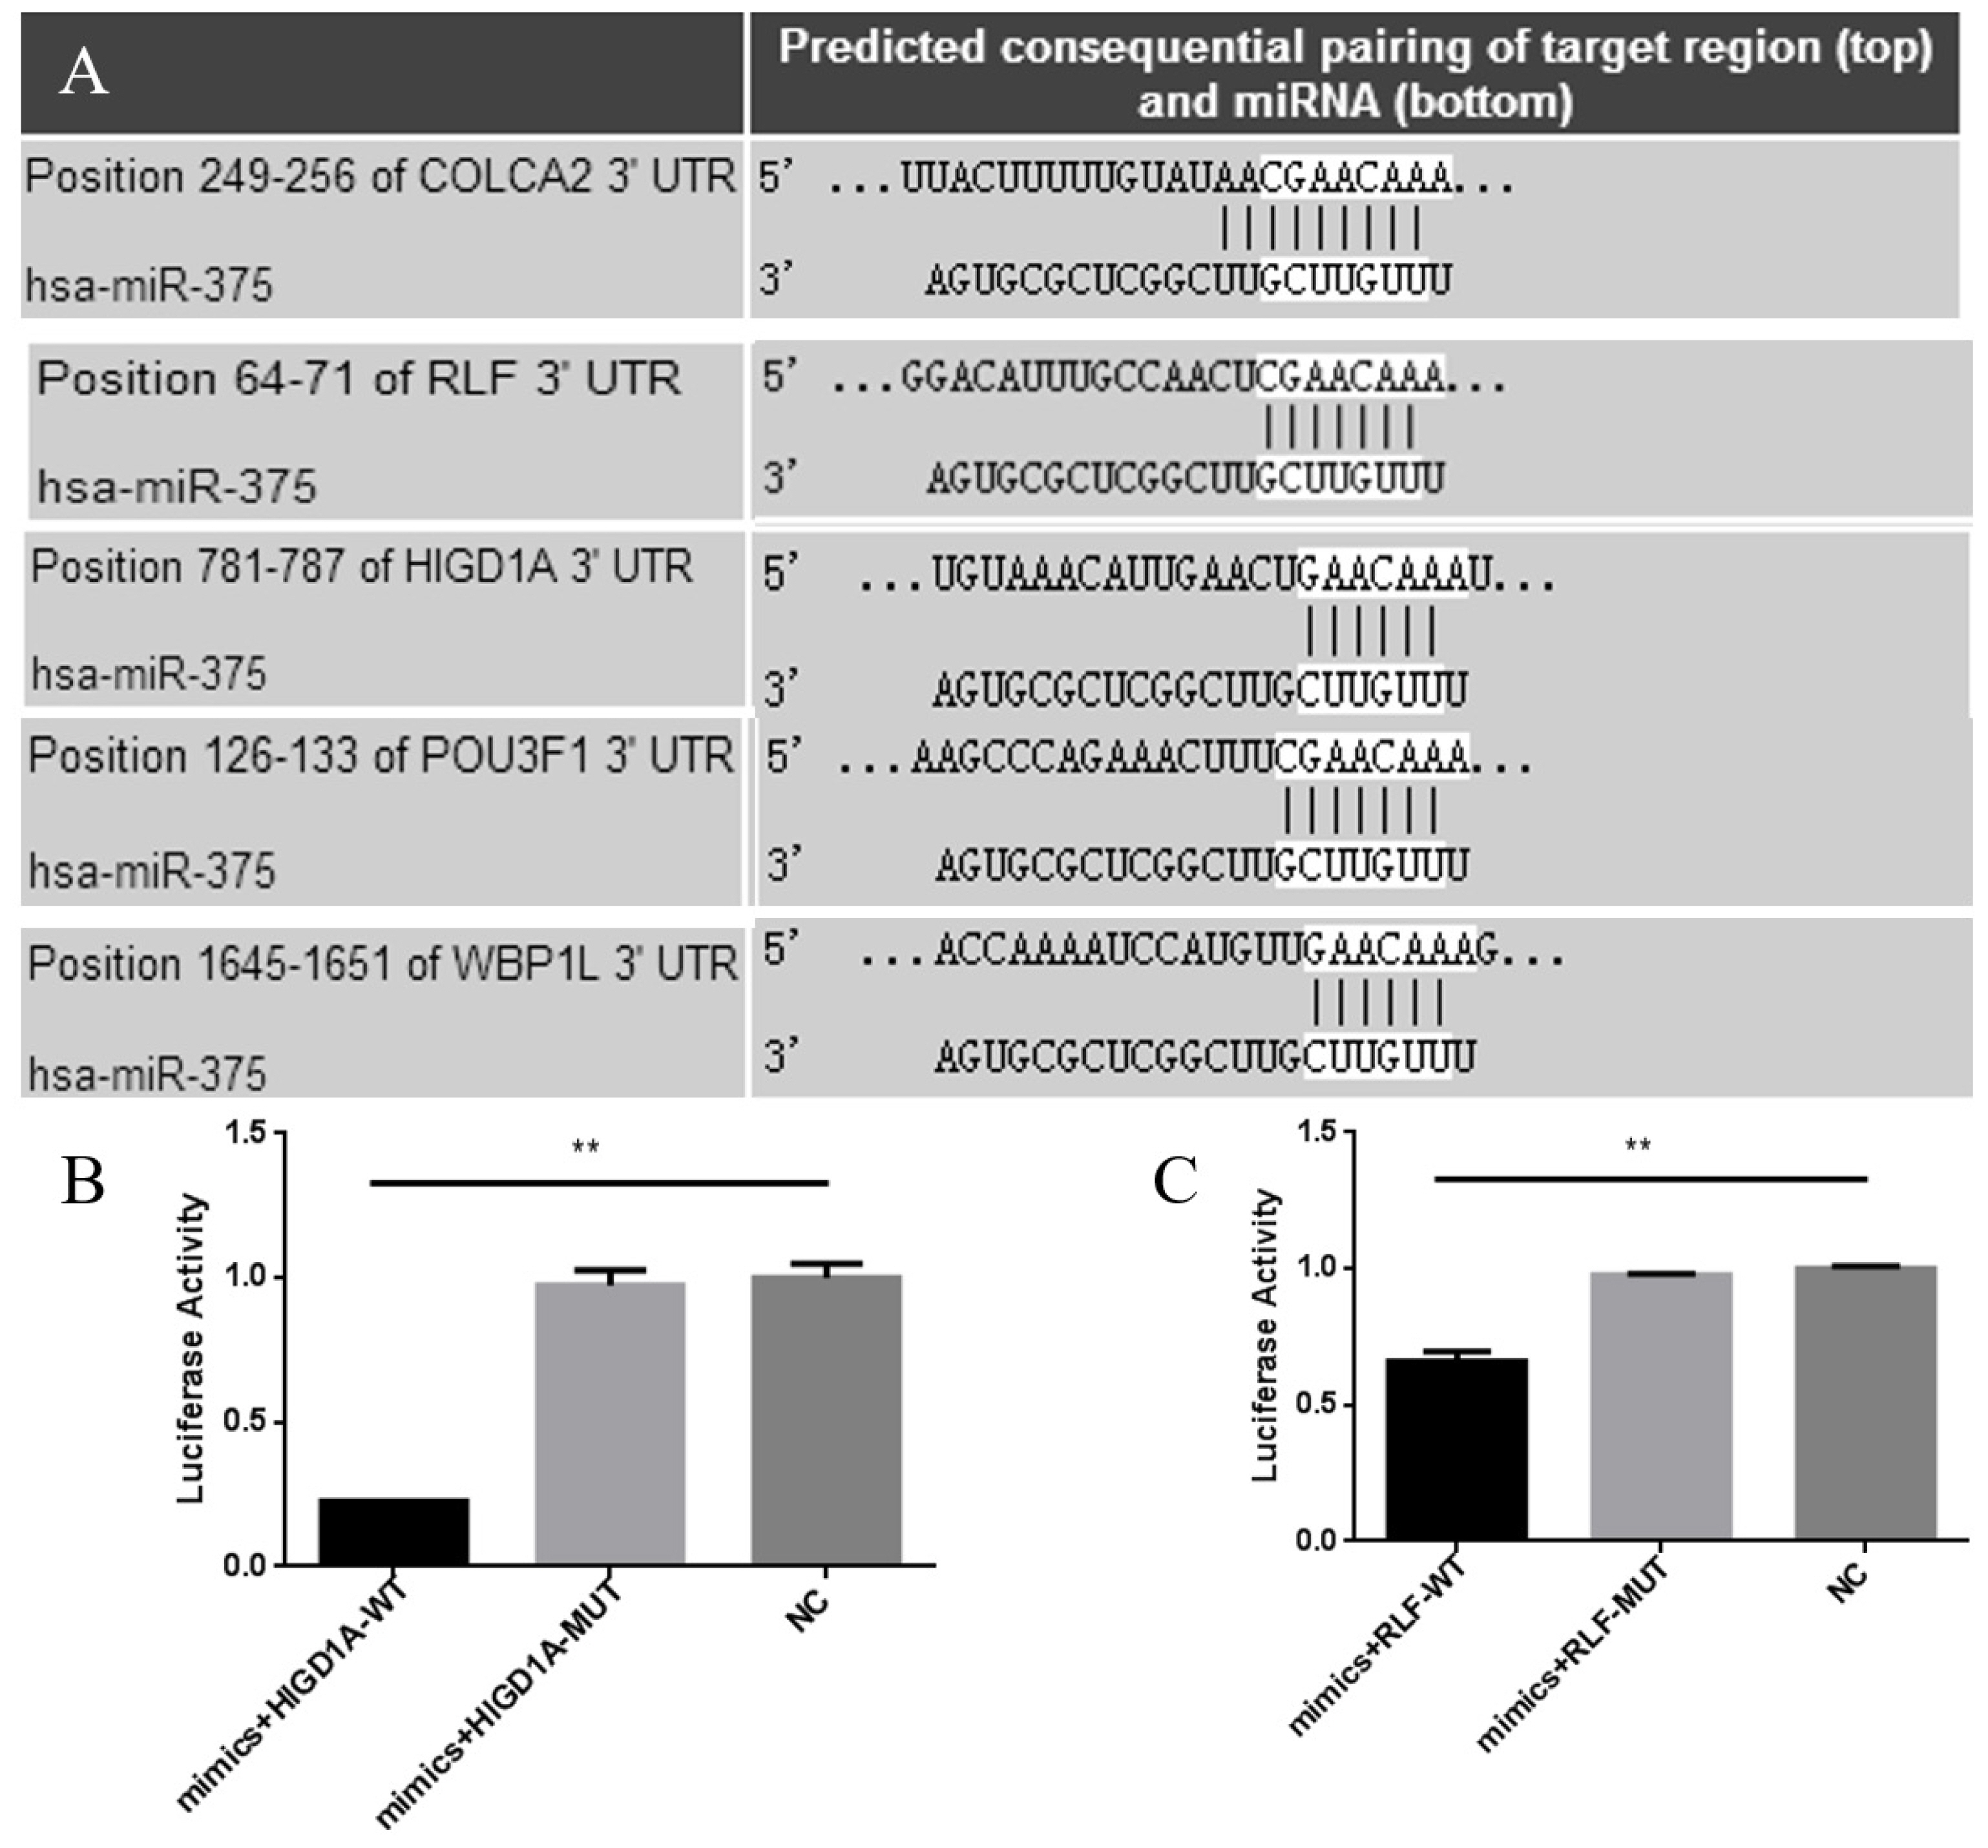
According to a bioinformatics website, the miR-375 binding sites in the 3 ′UTR region was predicted and matched, and five possible target genes of miR-375 were found, RLF, HIGD1A, COLCA2, POU3F1, and WBP1L (Figure 1). All of the possible target genes had either one or two miR-375 binding sites in the 3 ′UTR region.
miR-375 down-regulated the target genes RLF and HIGD1A
Expression of the GFP protein was observed in ST cells transfected with the miR-375 mimics, miR-375 inhibitor and miRNA-ShNC, suggesting that transfection was successful.
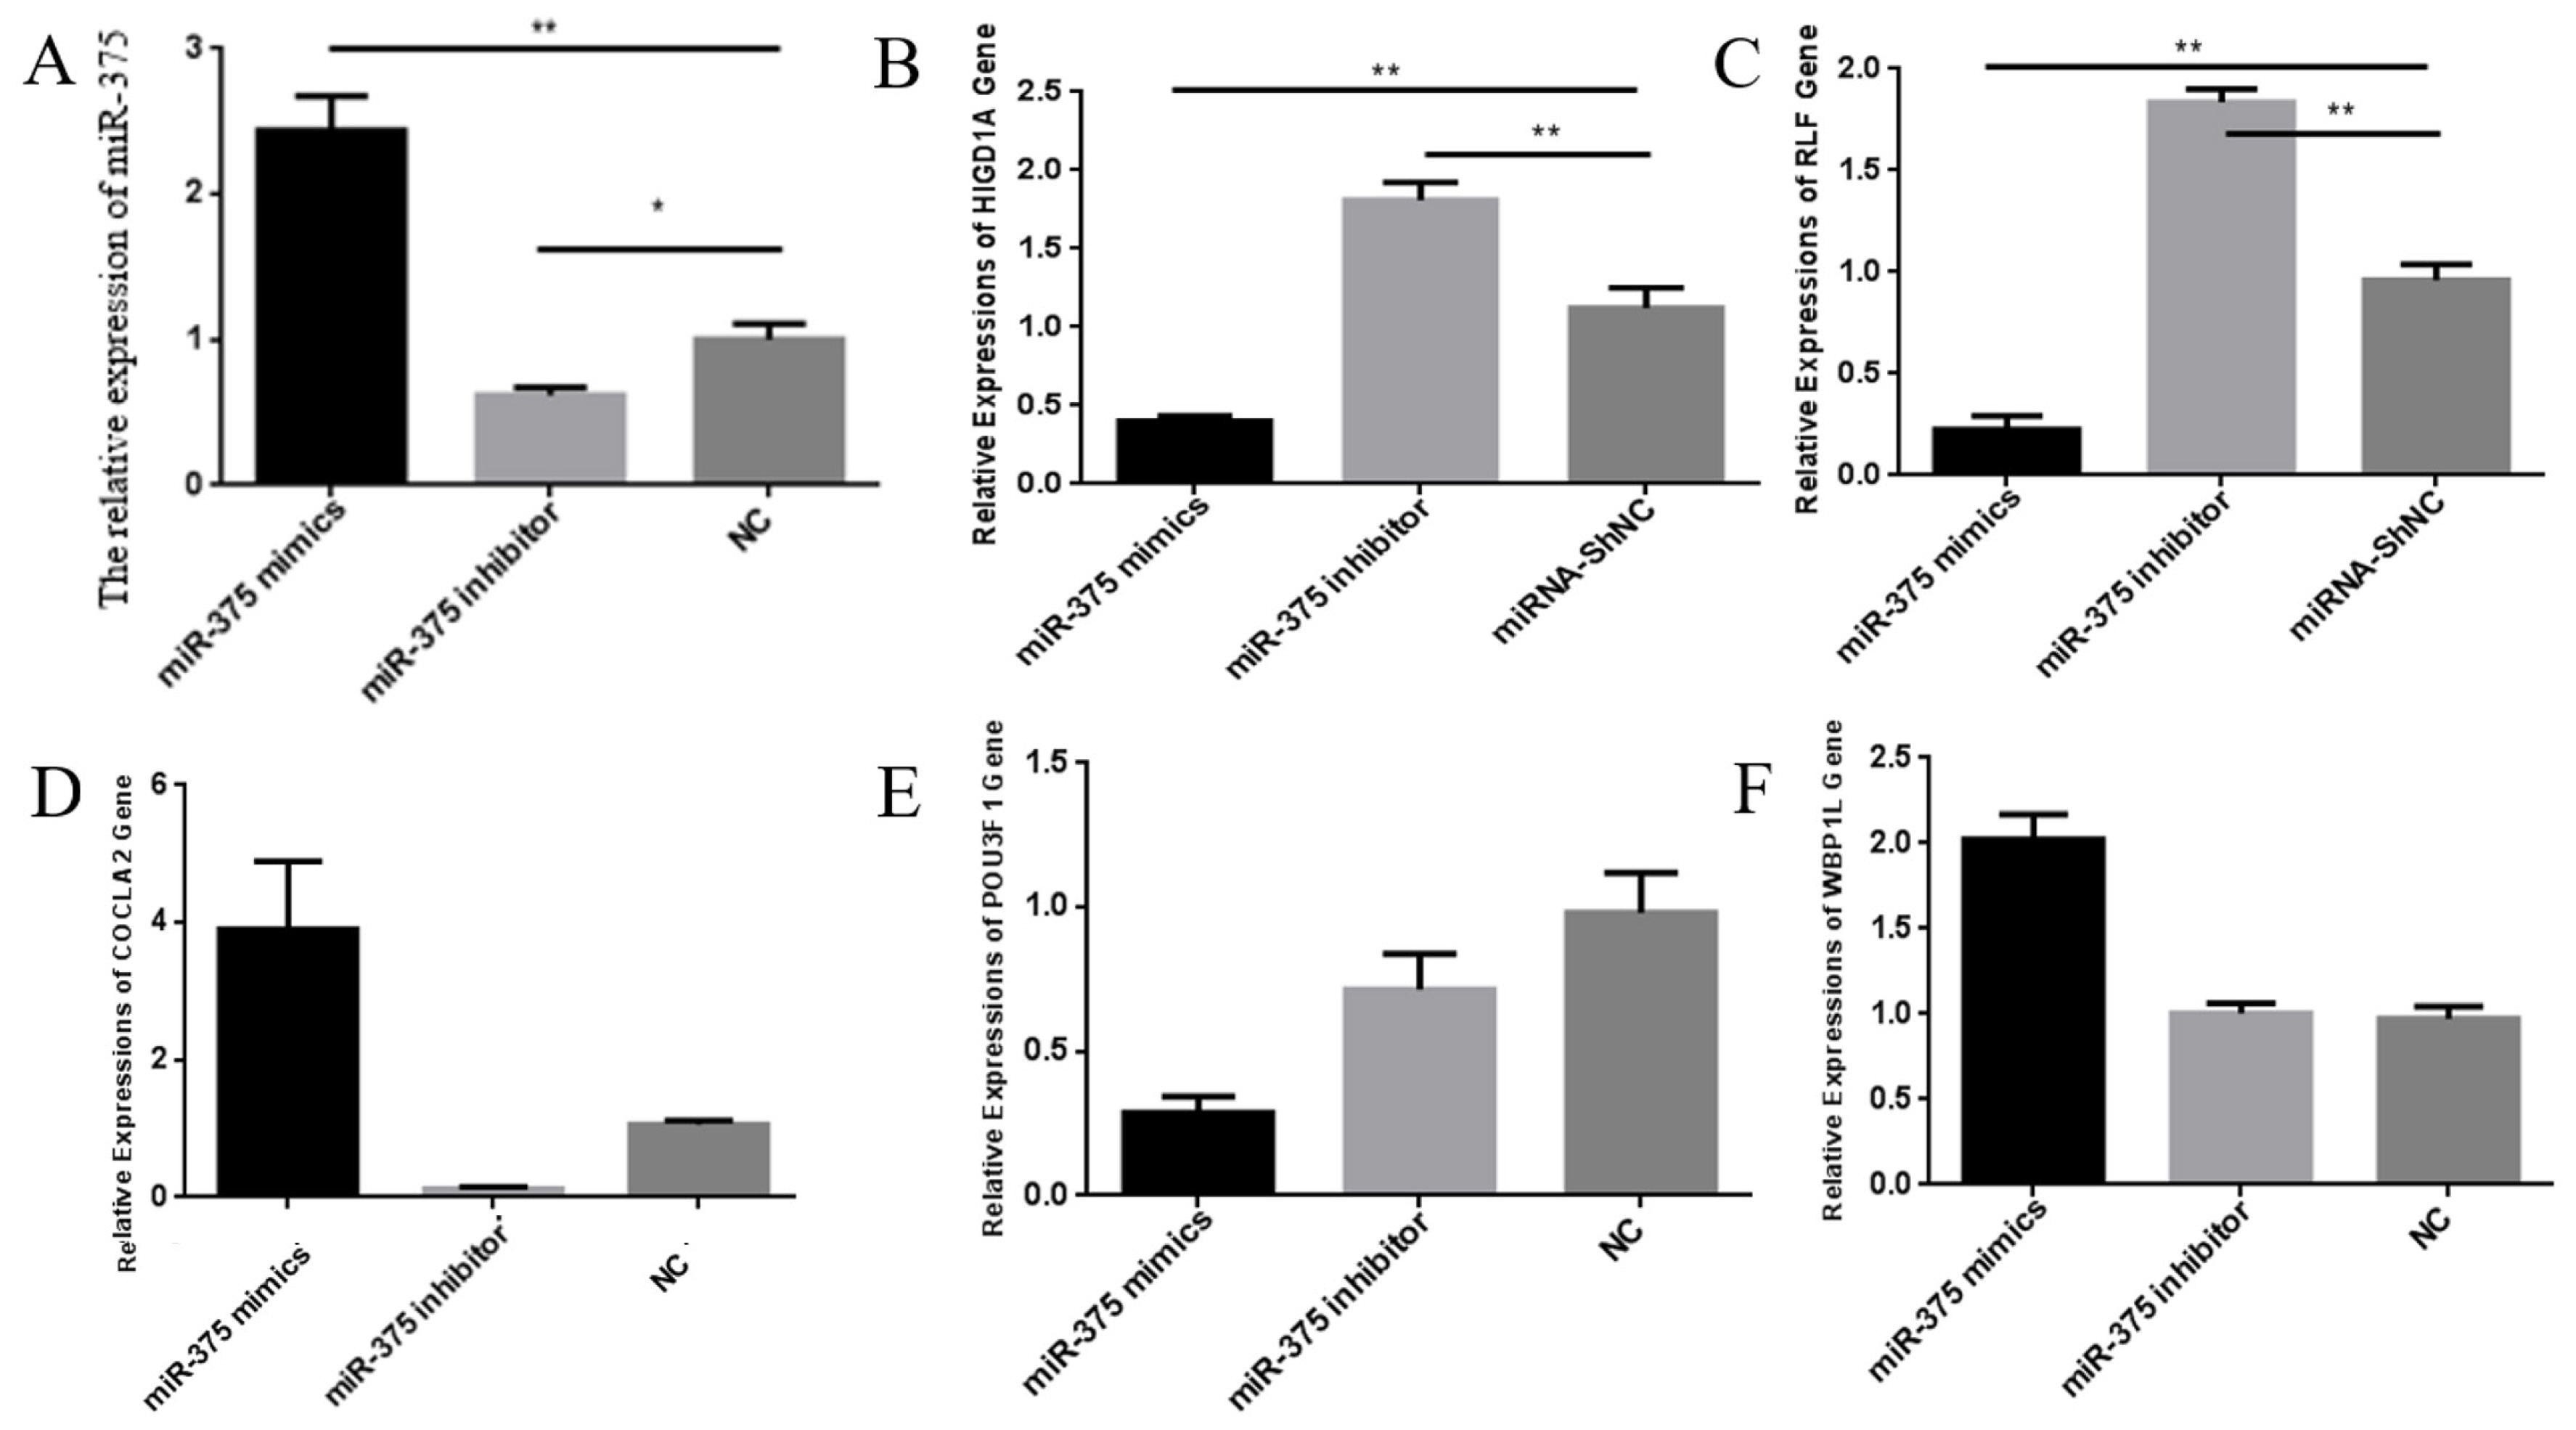
Expression of miR-375 in ST cells is shown in Figure 2. The qPCR results showed that expression of miR-375 in ST cells transfected with mimics exhibited a significant increase compared with cells transfected with inhibitor or shNC. In addition, expression of miR-375 was dramatically decreased in ST cells transfected with inhibitor compared with cells transfected with shNC. Expression of RLF, HIGD1A, COLCA2, POU3F1, and WBP1L in ST cells was demonstrated in cells transfected with the mimics, inhibitor and shNC (Figure 2). Subsequent analysis of the target gene showed that expressions of RLF and HIGD1A were negatively correlated with miR-375. COLCA2 has a positive correlation with miR-375. Both transfections with miR-375 mimics and the miR-375 inhibitor up-regulated the target gene POU3F1. ST cells transfected with miR-375 mimics up-regulated the target gene WBP1L. There was no significant difference between ST cells transfected with the miR-375 inhibitor and miRNA-shNC. Expression of COLCA2, POU3F1, and WBP1L in ST cells transfected with mimics, inhibitor and shNC is not negatively correlated with miR-375. Therefore, in the following experiment, we validated two possible target genes, RLF and HIGD1A.
Furthermore, the ELISA results were the same as those of qPCR analysis. Protein expression of RLF and HIGD1A were negatively correlated with miR-375 (Figure 3). Further evidence suggests that RLF and HIGD1A might be the target genes of miR-375.
Validation of the specific binding of RLF and HIGD1A with miR-375 by luciferase assays
Bioinformatics analysis revealed that there was one miR-375 conservative site on the 3′UTRs of RLF and HIGD1A (Figure 1). To verify whether miR-375 can bind to RLF and HIGD1A, we used the dual luciferase report assay. As shown in Figure 3, the luciferase activities of ST cells transfected with the RLF-WT or HIGD1A-WT vector significantly decreased compared with ST cells transfected with the RLF-MUT vector of HIGD1A-MUT vector. It was also observed that the luciferase activities were not significantly different after transfection of the RLF-MUT and HIGD1A-MUT vectors (Figure 4). The luciferase assay results proved that RLF and HIGD1A can bind specifically to miR-375.
miR-375 inhibited proliferation of ST cells
The MTS assay results suggested that ST cells transfected with the miR-375 inhibitor have a faster proliferation rate after 24 hours than ST cells transfected with miR-375 mimics (Figure 3).
DISCUSSION
MicroRNAs (miRNAs) are a general class of endogenous non-coding RNAs that are 22 nucleotides long, are found in diverse species and play important roles in the initiation and progression of malignancies. miRNAs are essential to many in vivo biological processes, such as cell proliferation, apoptosis, the immune response and tumorigenesis [12].
miRNAs regulate expression of the target genes in animals and plants at the post transcriptional level and reduce the mRNA or protein translation level of target genes. Especially regarding the translation repression effect, miRNA combines with mRNA rather than directly degrading it, resulting in translational repression [13]. Therefore, regulation of this gene does not significantly reduce the mRNA level a gene, which makes it necessary to detect expression at the protein level to understand the regulatory effects of miRNA. However, by using few experiments, it was shown that miRNA can regulate the expression of target genes [14]. In summary, the relationship between miRNA and expression of the target genes at the cellular mRNA and protein levels can be used to determine whether there is a relationship with a target gene. In this study, it was found that the expression level of miR-375 in ST cells was negatively correlated with the mRNA and protein levels of the possible target genes RLF and HIGD1A, suggesting that RLF and HIGD1A might be targeted by miR-375.
It is widely known that the classical miRNA gene silencing mechanism suggests that the body forms mature miRNA and a silencing complex that contains Argonaute and other proteins. This strategy makes use of the principle of complementary base specific recognition in combination with the 3′ UTR to predict the target mRNA. The translation efficiency or stability of mRNA was regulated, and expression of specific genes in the cytoplasm was controlled [15]. Possible target gene mRNA was predicted using the principle of specificity and the 3′ UTR.
miRNA is composed of small RNA of more than 20 bases, specifically, six to seven bases of seed regions that are specifically combined with the target gene 3′ UTR target site. miRNA can directly degrade or inhibit expression of target genes and regulate biological functions of an organism. However, when a base mutation or deletion occurs in the seed zone, alterations of biological function can result. The most effective way to detect the specific binding between miRNA and its target genes is to use the double luciferase reporter gene system. This system can detect degradation of the target gene by marker miRNA. The double luciferase reporter gene is expressed under the control of a promoter. If miRNA can specifically bind to the target 3′ UTR sequence and inhibit transcription, it will reduce expression of wild-type double luciferase. By contrast, if miRNA cannot bind to the target gene sequence, the luciferase reporter gene results will not change.
Bioinformatics analysis confirmed the existence of miR-375 target sites in the 3′ UTR of RLF and HIGD1A, and the dual luciferase reporter gene assay further validated that RLF and HIGD1A were targeted by miR-375. The results showed that RLF and HIGD1A are target genes of miR-375.
In this study, it was found that miR-375 inhibits ST cell proliferation. Sertoli cells provide structural and nutritional support for germ cell development. ST cells actively metabolize glucose and convert it to lactate, which is an important source of energy for germ cells. Furthermore, Sertoli cells can oxidize fatty acids, a metabolic process that is assumed to fulfill their own energy requirements [16]. ST cells play an important role in the development of germ cells and in providing the energy source for germ cells. Because miR-375 inhibited proliferation of ST cells, inhibition of miR-375 likely plays roles in the development of germ cells and energy metabolism.

 PDF Links
 PubReader
 ePub Link
 Full text via DOI
 Full text via PMC
 Download Citation
 Print
Print


