Go to Top Go to Bottom
Thanh and Suksombat: Milk Production and Income over Feed Costs in Dairy Cows Fed Medium-roasted Soybean Meal and Corn Dried Distiller’s Grains with Solubles

Abstract

The aims of this study were to determine the effects of feeding medium-roasted soybean meal (SBM) and corn dried distiller’s grains with solubles (CDDGS) in dairy cows on milk production and income over feed costs. A randomized complete block design experiment was conducted with 24 crossbred multiparous Holstein Friesian dairy cows in early- and mid-lactation. Four dietary treatments were as follows: basal diet without feed substitute (Control), 7.17% dry matter (DM) roasted SBM replaced for concentrate (R-SBM), 11.50% DM CDDGS replaced for concentrate (DDGS), and 3.58% DM roasted SBM plus 5.75% DM CDDGS replaced for concentrate (SB-DG). The roasted SBM was produced using a medium-heated treatment at 100°C for 180 min. Dry matter intake was not affected by feeding high rumen undegradable protein (RUP) sources, but the replacement of roasted SBM and CDDGS for concentrate significantly improved (p<0.001) RUP intake (0.90, 0.86, and 0.88 kg/d corresponding to R-SBM, DDGS, and SB-DG) compared to the control (0.61 kg/d). Feeding roasted SBM and CDDGS alone or in combination had no significant effect on milk composition of dairy cows (p>0.05), whereas milk yield was significantly increased by 3.08 kg/d in the SB-DG group relative to the control group (p<0.01). Net income was meaningfully increased (p<0.05) from 4th week post feeding, the SB-DG group reached the greatest net income ($3.48/head/d) while the control group had the lowest value ($2.60/head/d). In conclusion, the use of CDDGS alone or in combination with medium-roasted SBM as substitute for concentrate in lactating dairy cattle diet led to improved milk production and net income over feed costs without affecting total dry matter intake and milk composition, while feeding medium-roasted SBM seemed to show intermediate values in almost parameters.

INTRODUCTION

Milk consumption has rapidly increased, and the annual per capita consumption of milk in developing countries is projected to increase from 52 kg in 2005 through 2007 to 66 kg in 2030 and 76 kg in 2050 (Alexandratos and Bruinsma, 2012); however, milk production of dairy cows in developing countries in the tropical region is still very low, less than 15 kg/cow/d in average (Aguilar-Pérez et al., 2009; Chingala et al., 2013; Wanapat et al., 2013). Although feeding strategy to improve milk production in dairy cows through protein supplement has been extensively studied, feeding of rumen degradable protein (RDP) in excess of microbial utilization contributes to pre-duodenal nitrogen (N) losses environmental emission of nitrogen which is one of the pollutants contributing to ground water nitrate, surface water eutrophication, and atmospheric ammonia and nitrous oxide emissions (US EPA, 2011). Therefore, manipulation of dietary protein is a critical strategy that will not only abate nitrogen emissions, but can also be economically feasible for the producers (Hristov et al., 2011). The use of high quality protein sources like soybean meal (SBM) may be more efficient if their proteins are mainly protected from ruminal degradation to directly supply amino acids for host animals’ production. Roasting treatment, one of protection methods of SBM protein, which has been showed to be feasible, environmentally friendly, and relatively cheap compared to other methods (such as plant breeding and chemical treatments) and does not cause any health hazard to animals and consumers (Goelema, 1999). This method can even improve its nutritional quality of SBM by destruction of some heat labile anti-metabolites (Masoero et al., 2005) and increase its rumen undegradable protein (RUP).
In recent years, due to steadily increasing crude oil prices, the corn ethanol production industry has been expanding rapidly and increased production of corn dried distiller’s grains with solubles (CDDGS) available for feeding to dairy cattle. In comparison with SBM, CDDGS has more RUP, and their intestinal digestibility is lower (Kleinschmit et al., 2007). Moreover, NRC (2001) indicates that milk yield increase linearly to RUP at the rate of 1.85 kg for each percentage unit increase in RUP, indicating increased efficiency of N utilization use for milk production. Therefore, the aims of this study were to determine milk production and income over feed costs in dairy cows fed medium-roasted SBM and CDDGS.

MATERIALS AND METHODS

Animals, experimental design, and diets

Twenty four crossbred multiparous Holstein Friesian lactating dairy cows in early- (12 cows, 47.67±10.88 days in milk) and mid-lactation (12 cows, 134.67±17.57 days in milk) averaging 10.41±1.27 kg of milk and 346.54±27.30 kg of body weight, were housed in individual tie stalls and offered daily rations as equal meals at 06:00 and 17:00 h. The animals had free access to water and mineral block, and they had enough space to walk. The animals were assigned to a randomized complete block design experiment which lasted for 6 weeks consisting a former 2-week for adjustment, followed by a latter 4-week for sample collection. Cows were blocked by lactating stage and were then randomly assigned to 1 of 4 treatments. The cows were fed a basal diet based on corn silage and concentrate at 27.17% RUP in dietary crude protein (CP). Four dietary treatments were as follows: basal diet without feed substitute (Control), 7.17% dry matter (DM) roasted SBM replaced for concentrate (R-SBM), 11.50% DM CDDGS replaced for concentrate (DDGS), and 3.58% DM roasted SBM plus 5.75% DM CDDGS replaced for concentrate (SB-DG). The roasted SBM and CDDGS were substituted for concentrate to meet 35.00% RUP in dietary CP. The daily amounts of roasted SBM and CDDGS were offered together with a 21% CP concentrate before feeding corn silage. The concentrate was formulated to meet nutrient requirements of dairy cows (NRC, 2001), while corn silage was offered ad libitum as a main roughage source. Chemical composition of experimental feeds and diets is showed in Table 1 and 2. The medium-roasting process to achieve protected SBM was handled as follow: i) The raw SBM was procured in Thailand and was medium-roasted using a temperature-controlled mixer with a roasting temperature around 100±5°C for 180 min or high-roasted using a tray drying oven with a roasting temperature around 130°C for 30 min. ii) After heating, the roasted SBM was cooled down to room temperature, re-bagged, and kept in the storeroom close the cows’ shed for further use. Representative samples (200 g each) of raw SBM, roasted SBM, and other experimental feeds were collected for an in situ nylon bag technique to evaluate protein quality.

In situ technology

Three multiparous crossbred Holstein Friesian non-lactafting cows fitted with ruminal cannulas were used in the in situ technique. The cows were kept in individual stalls and had free access to water and mineral block. All animals were daily fed 3 kg of 21% CP concentrate, while corn silage was offered ad libitum. Diet was offered in equal amounts twice daily at 08:00 and 16:00 h for ad libitum intake (at least 10% refusals). In situ bags made from Dacron cloth (18×9 cm, 52 μ pore size) were prepared as described by Shaver et al. (1986). Pre-weighed nylon bags containing approximately 5 g of raw SBM, roasted SBM, CDDGS, and concentrate (ground to pass a 2.5-mm sieve) were immersed in duplicate at each time point in each cow in reverse order at 2, 4, 8, 16, 24, and 48 h, while in situ bags of corn silage were carried out at 4, 8, 16, 24, 48, and 72 h. The in situ bags were tied to a weighted chain and located in the ventral rumen. Six measurements were made for each test feed at each time point (3 cows×2 replicates). After incubation, all bags were removed at the same time and hand washed until rinsing is clear. Zero hour bags were soaked in tepid tap water for 30 min prior to hand washing to estimate the rapid disappearance. Bags were then dried at 60°C for 48 h in a forced-air oven. Residual DM of each bag was corrected for DM entry into their corresponding blank bags. Dried residues from six bags at each time point was composited for further analysis of N content to estimate protein degradability. The degradability values was obtained by subjecting nutrient losses at arbitrary of time using NEWAY EXCEL (Chen, 1996).

Sampling, measurements, and chemical analysis

Feeds offered and residual were daily recorded, and feed samples were collected for two consecutive days weekly to calculate daily feed intake. Feed samples were taken and dried at 60°C for 48 h. Feed samples were ground through a 1-mm screen and subjected to proximate analysis. Crude protein was determined by Kjeldahl method (procedure 928.08, AOAC, 1998). Ether extract was determined by using petroleum ether in a Soxtec System (procedure 948.15, AOAC, 1998). Neutral detergent fiber (NDF) and acid detergent fiber (ADF) were determined using the method described by Van Soest et al. (1991). The NDF analysis used sodium sulfite in the neutral detergent solution. Both NDF and ADF are expressed inclusive of residual ash. Net energy for lactation (NEL; Mcal/kg) of feeds was calculated according to the equations of NRC (2001). Chemical analysis was expressed on the basis of final DM. Live weights (LW) were recorded at the initial and end of the experiment to calculate LW change. The cows were milked daily at 05:00 and 16:00 h, and milk yields were recorded at each milking time. Milk from both morning and afternoon milking were sampled weekly in 2 consecutive milking days. The morning milk samples of each cow were pooled to one composite sample, afternoon samples were also pooled to another one composite sample for the meanwhile. The composite milk samples of both milking times were analyzed for milk composition including fat, protein, casein, lactose, solid not fat, total solid, urea, free fatty acid, citric acid, and acidity using a MilkoScan FT2 infrared automatic analyser (Foss, Hillerød, Denmark).

Statistical analysis

In situ degradation kinetics

From the in situ degradability data at different hours with respect to DM and CP degradability in the rumen, the effective degradability of DM and CP was calculated as described by Woods et al. (2002) using an exponential model of Ørskov and McDonald (1979) described as p = a+b×(1−ect), where p = rumen disappearance (%) at time t (h); a = water soluble fraction (%); b = water insoluble but potentially degradable fraction (%); c = rate at which b is degraded (rate constant) (%/h); t = incubation time (h); and e = 2.7182 (natural logarithm base). The ED of feeds = a+(b×c)/(c+k) (Ørskov and McDonald, 1979), where ED = effective degradability; a, b, and c = constant parameters as described above; and k = rate constant of passage. When calculating effective degradability, rate constant of passage was assumed to be 0.05 per hour which feed flows from the rumen to the small intestine (Ørskov and McDonald, 1979).

In vivo data

Data for body weight were analyzed using analysis of variance (ANOVA) procedure of SAS (SAS, 2002) for a randomized complete block design with the following statistical model:
Yijk=μ+Bi+Tj+ɛijk,
where Yijk = the dependent variable, μ = the overall mean, Bi = the block effect, Tj = the treatment effect, and ɛijk = the random residual error.
The ANOVA for averages of feed intakes, milk yield, milk composition, and feed efficiency were analyzed according to a completely randomized block design with the repeated measures (weeks) using PROC MIXED procedure of SAS (SAS, 2002). The statistical model used was as follows:
Yijklm=μ+Ai+Bj+Tk+Wl+(T×W)kl+ɛijklm,
where Yijklm = the dependent variable, μ = the overall mean, Ai = the random effect of animal, Bj = the fixed effect of block, Tk = the fixed effect of treatment, Wl = the fixed effect of week, (T×W)kl = the fixed effect of interaction between treatment and week, and ɛijklm = the random residual error.
Significant differences among treatment means were assessed by Tukey’s multiple comparison tests after a significant F-test. Overall differences between treatment means were considered to be significant as p≤0.05, meanwhile a tendency toward was declared at 0.10>p>0.05. Data are expressed as mean±standard error of the mean (SEM), which represents the pooled SEM for the model.

RESULTS

Degradation kenetics

The degradation kenetics of DM and CP are given in the Table 3. Concentrate, corn silage and raw SBM were high in effective degradability of DM and CP that resulted in the obviously lower RUP in these feeds (22.60, 24.60, and 34.00, respectively), whereas RUP was predominant in corn DDGS (60.00%). The roasted treatment strongly improved RUP of SBM, 63.30% and 70.50% corresponding to medium- and high roasting treatments. The readily and potentially degradable fractions (a+b) were higher in raw SBM than those in roasted SBM products, this indicated that roasting treatments might have effects on some physical or chemical characteristics of raw SBM, resulting in reduction of these fractions. The heating methods reduced the readily soluble fraction (a) and increased the potentially degradable fraction (b), the numerous changes were observed for high-roasted SBM as compares to medium-roasted soybean meal and raw SBM.

Intakes and live weight change

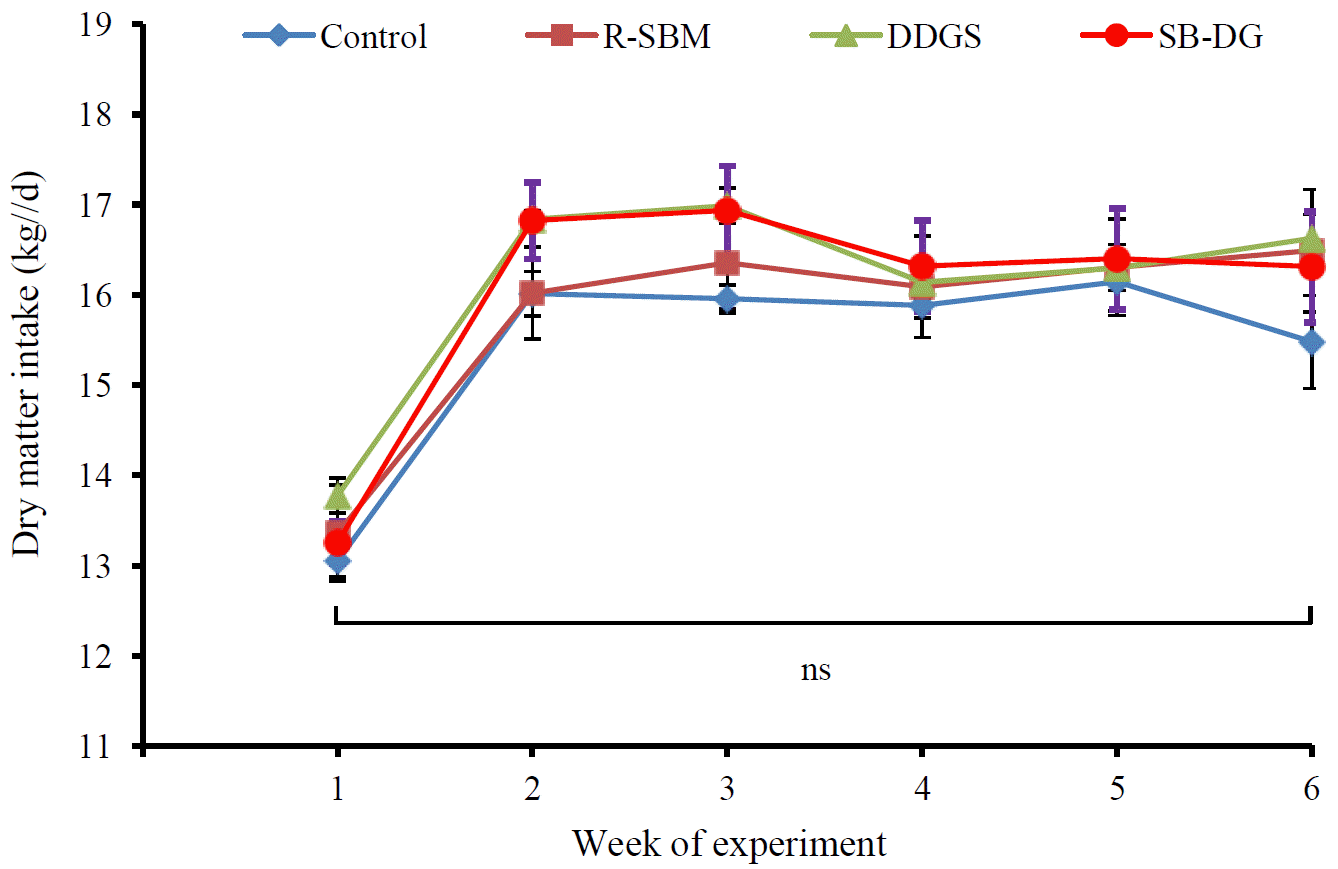
The different intakes of concentrate, roasted SBM and CDDGS were results of roasted SBM and CDDGS replacements for concentrate in the study; however, DM intake was non significantly higher in the treatment animals over the control animals with respect to corn silage and total DM intake which expressed as kg/d, g/kg LW and g/kg LW0.75 (Table 4 and Figure 1). The roughage and concentrate proportions in the diets are similar among groups (p>0.05). The replacements of roasted SBM and CDDGS for concentrate in the diet led to significantly improve CP intake (p<0.001), accompanied by an increase of RUP intake (p<0.001), the higher values were in the treatment groups (0.90, 0.89, and 0.88 kg/d corresponding to R-SBM, DDGS, and SB-DG) as compared to 0.61 kg/d in the control group. Substitution of roasted SBM and CDDGS for concentrate tended to improve net energy for lactation (p<0.1) with the higher values were observed in the diets containing CDDGS (25.70 and 25.64 Mcal/d corresponding to DDGS and SB-DG) in contrast to the control diet (24.17 Mcal/d). No significant difference was measured for LW change among the diets (p>0.05).

Milk yield and composition

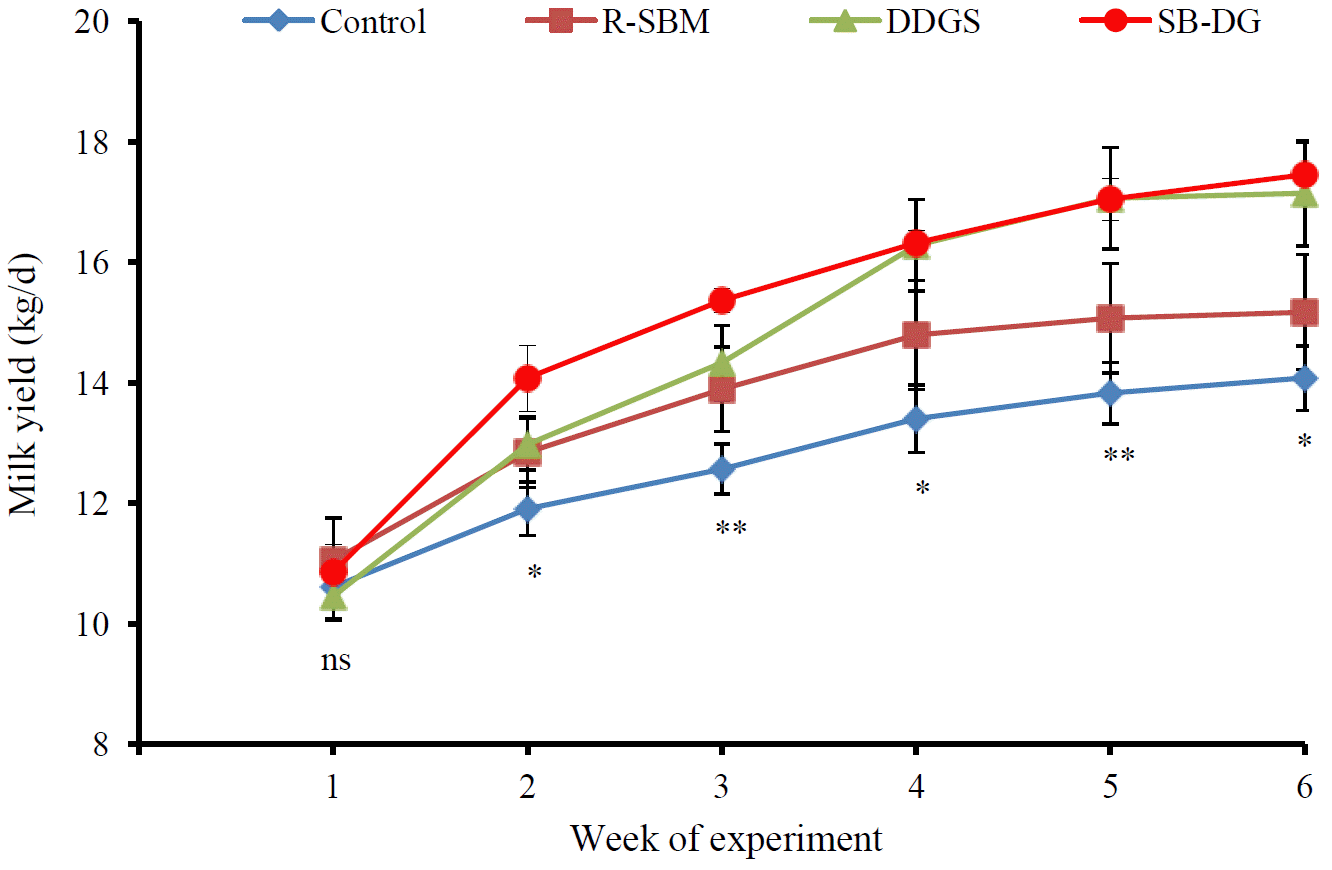
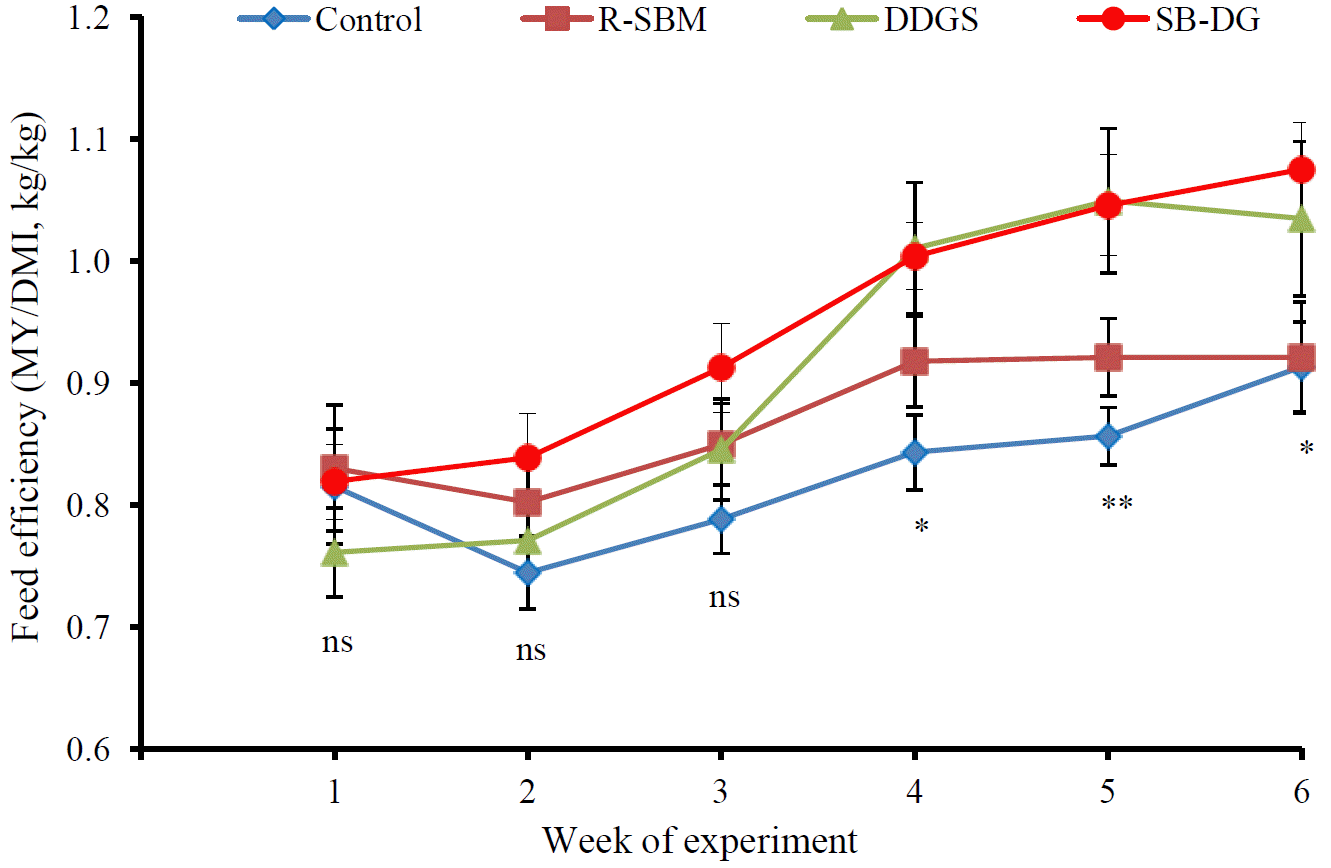
The results in the Table 5 show that feeding roasted SBM and CDDGS had no significant effect on milk composition of dairy cows for the entire period (p>0.05). However, the significantly higher milk and milk composition yields in the treatment groups resulted in improved feed efficiency. Particularly, the yields of milk, 3.5% fat corrected milk (FCM) and energy-corrected milk (ECM) were significantly greater (p<0.01) in the animals fed diet containing CDDGS compared to the animals feed control diet. In this study, milk yield in average was increased (p<0.01) by 3.08 kg/d in the SB-DG group relative to the control group (Table 5). Figure 2 represents weekly tendency of milk production throughout the experimental period. Substitutes of roasted SBM and CDDGS for concentrate had a significantly positive effect on milk yield after 1st week feeding (p<0.05), the highest milk yield was in the SB-DG group contrary to the lowest value in the control group, and this trend was remained forwards the end of the experiment. The meaningfully highest yields of protein, casein, lactose, and total solid were found in the SB-DG group (p<0.01), whereas milk fat yield was greatest in the DDGS group relative to the control group (p<0.05). While DM intake was remained unchanged over the entire feeding (Figure 1), an increase of milk yield in the animals fed DDGS and SB-DG diets led to significantly improve feed efficiency in terms of milk/dry matter intake (DMI), 3.5% FCM/DMI, ECM/DMI, and milk N/N intake (p<0.05) in these cows compared to those fed the control diet. The effect of feeding roasted SBM and CDDGS on feed efficiency was exposed after 3rd week feeding, the SB-DG group reached the greater peak, but the control group was on the bottom for the meanwhile (p<0.05) till the end of the experiment (Figure 3). In this study, the animals fed R-SBM diet showed the intermediate values in almost parameters.

Net income

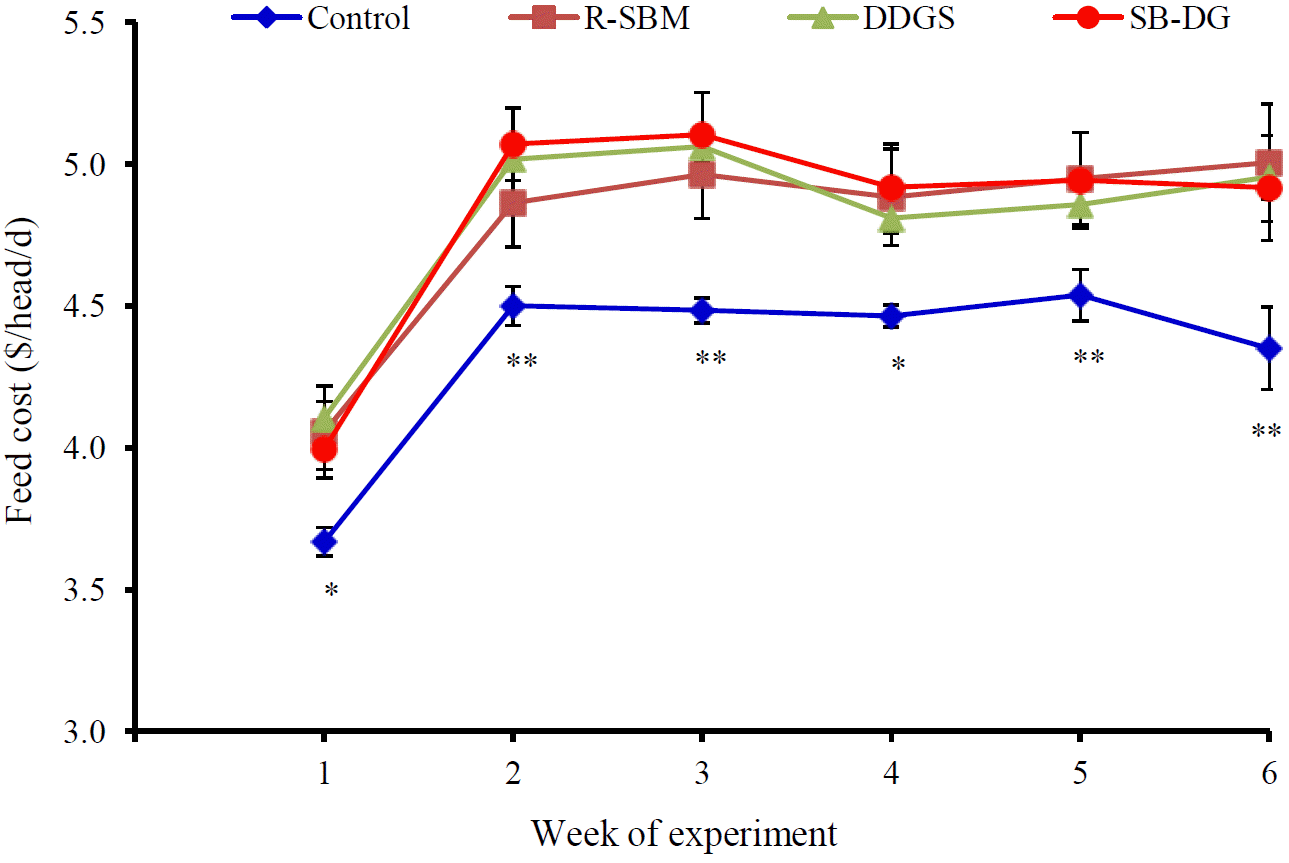
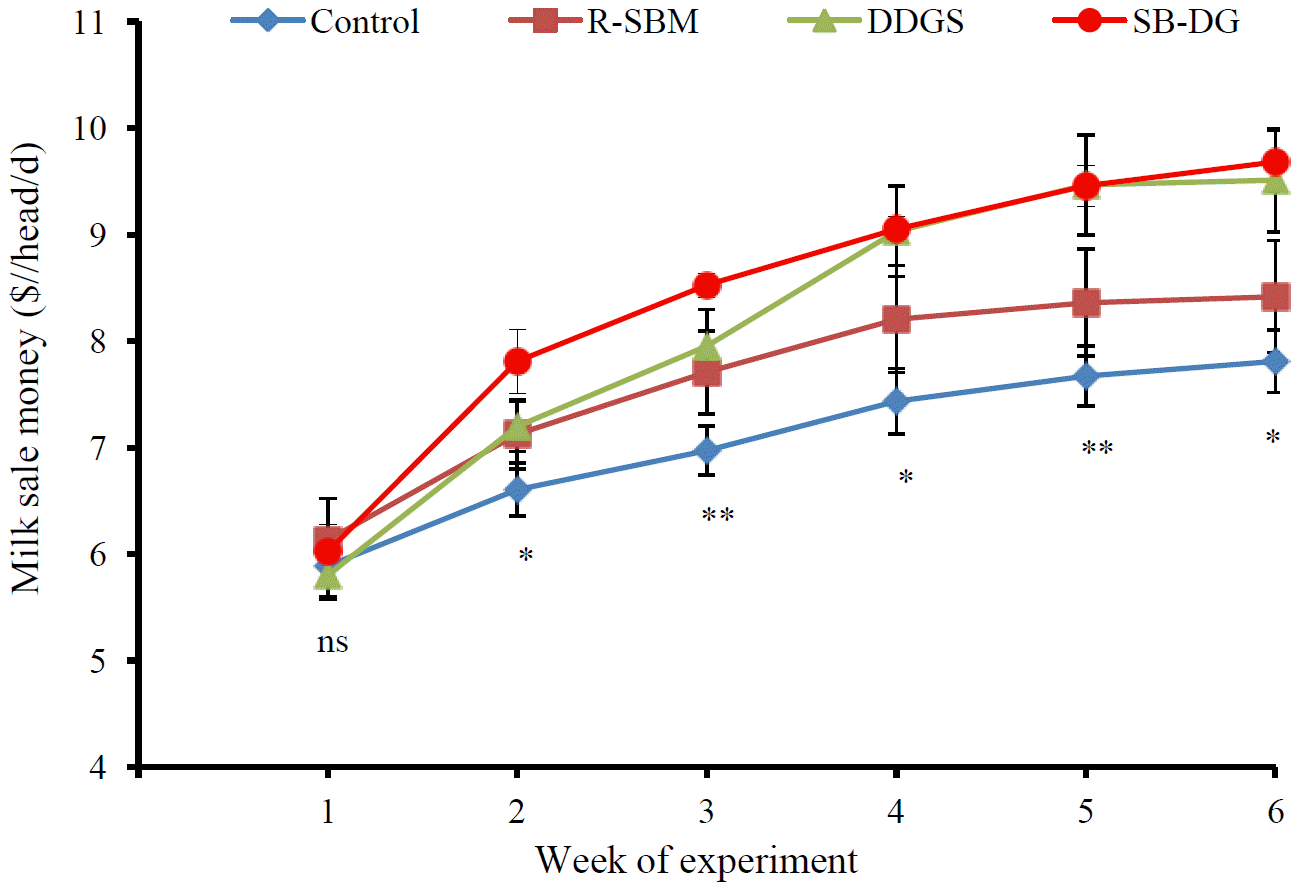
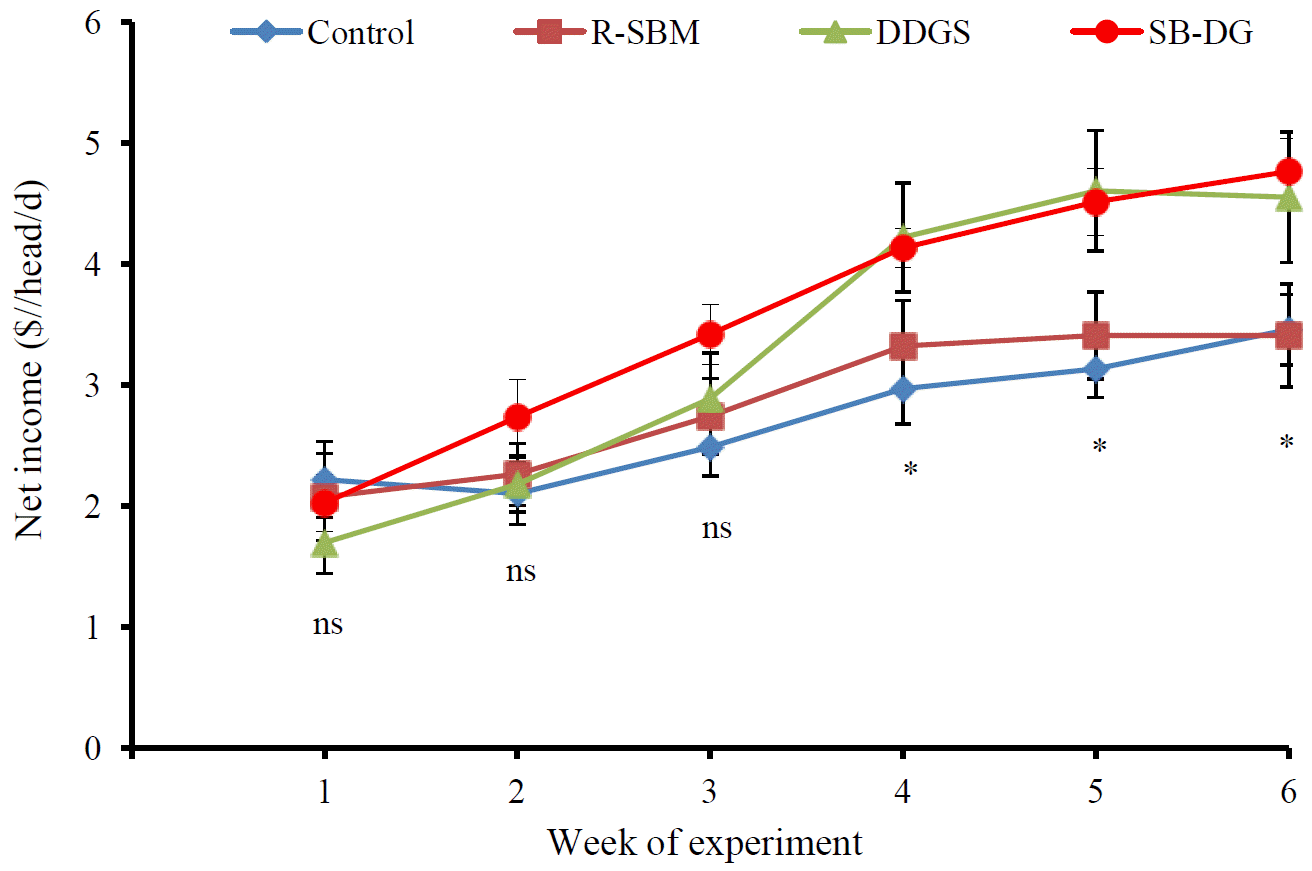
The most important thing of feeding strategy to improve animal performance is how it is beneficial for economic returns. The great finding in this study was that although feed cost was significantly higher in the animals fed diet containing roasted SBM and CDDGS for the whole feeding period compared to the control animals (p<0.05), net income was still remarkably increased in the DDGS and SB-DG groups (p<0.05) due to milk sale money was dramatically increased in these groups (p<0.05). In particularly, the average feed cost (Figure 4) in the whole study of the control group was on the bottom ($4.46/head/d) while this was 4.90, 4.90, and $4.95/head/d corresponding to R-SBM, DDGS, and SB-DG groups. As the result of increased milk yield (Figure 2), milk sale money (Figure 5) was remarkably improved after 1st week by feeding high RUP sources, the highest value in average was observed for SB-DG group ($8.43/head/d) in contrast to the lower value in the control group ($7.06/head/d). The final calculation for net income over the feed cost (Figure 6) shows that net income was meaningfully increased from 4th week post feeding, the SB-DG group reached the greatest net income in average ($3.48/head/d) while the control group got the lowest value ($2.60/head/d).

DISCUSSION

Rumen undegradable protein of roasted soybean meal and corn dried distiller’s grains with solubles

It clearly shows from this study that roasting treatments had strong effect on RUP of SBM. The remarkable increase in RUP in roasted SBM could be attributed to suitable time and temperatures of both heated treatments, 100°C for 180 min (medium-roasted method) and 130°C for 30 min (high-roasted method). Soy protein could be protected to the desired level at these time and temperature points. Fathi Nasri et al. (2008) even suggested the higher temperature between 140°C and 150°C to protect soybean protein, but these high temperatures may cause an unfeasible application in farm or even small factory, more expensive, and over-protection of protein to compare with lower temperature. In this study, the heat transferred from tray drying oven heater (high roasting method) to raw soybean materials recorded during heat processing was very different between the samples located at the top and bottom of feed trays, approximately 20°C variation. Meanwhile, SBM product obtaining from medium-roasted method was homogenized due to the heat exchange of this process was controlled, and raw SBM was well mixed during the treatment. Therefore, only SBM product achieving from medium-roasted method was chosen to use for the feeding trial. It is clear that roasting method should have an appropriate time and temperature combination for effective bypassing rumen. Roasting of soybean led to increase its bypass protein as reflected by increasing in RUP value and a corresponding decrease in effective protein degradability (Fathi Nasri et al., 2008; Sirohi et al., 2011). The increase in protein bypass ability was also caused the changes in protein fractions due to heat transfer during roasting (Fathi Nasri et al., 2008). Sirohi et al. (2011) reported that roasting method also led to increase undegradable protein fractions for the whole digestive tract, which may be corresponding to an increase in the formation of indigestible N containing compounds (Maillard products) resulting from heat treatment and also indicates decreases in nutritive value, especially protein. The estimating RUP of CDDGS in the current study was 60.0%. This is greater than the values reported by Schingoethe et al. (2009) and Kelzer et al. (2010), who estimated that the CDDGS RUP was 55.0 and 56.3%, respectively. However, the calculated result of CDDGS RUP in this study is still less in comparison with 63.0% in the research of Castillo-Lopez et al. (2013) and 70.3% reported by NRC (2001). These variable results may be due to the different processes of corn ethanol production industry. Kleinschmit et al. (2007) concluded that the heat applied during the drying process may reduce the availability of protein to ruminal degradation, resulting in improved RUP.

Intake, milk yield, milk composition, and net income

In this study, a no significant different effect on DM intake by dietary RUP supplement was in agreement with some previous studies (Anderson et al., 2006; Sirohi et al., 2011). Experimental diets were formulated to be dietary RDP levels at 103.12, 103.27, 97.14, and 100.21 g/kg DM corresponding to the control, R-SBM, DDGS, and SB-DG diets to meet or exceed the nutrient requirements of the lactating cows based on NRC (2001). According to NRC (2001), dietary RDP drops below 95 to 105 g/kg DM may depress microbial protein (MCP) production, which may accompany by low DM intake, digestibility, and milk production. Moreover, Boucher et al. (2007) reported a maximum response of MCP production when RDP was 100 to 108 g/kg DM, but MCP production decreased at 116 g/kg DM for the meanwhile, probably due to over-production of ammonia.
In the present study, no significant difference in milk protein concentration among treatments revealed that dietary treatments had no effect on microbial protein synthesis. The improved milk and milk composition yields in this study were in agreement with other researches evaluating either wet or dry distillers grains with solubles (Anderson et al., 2006; Janicek et al., 2008; Gehman and Kononoff, 2010). Recently, Sirohi et al. (2011) reported that roasted SBM inclusion in dairy cattle diet led to improve milk production without affecting the DM intake. The increased milk production was strongly observed when roasted SBM and CDDGS mixture added in the diet of dairy cows but this would depend upon the protein quality of feed currently used in the current study. The concentrate for dairy cattle was high in degradable nutrients as shown by very high effective degradability of CP (Table 3). Meanwhile, roasted SBM and CDDGS which contain high protein, particularly protected protein would be an ideal ingredient for dairy cattle feeding. The current results showed that while DM intake was constant over the whole period of feeding, milk yield increase could be attributed to the increase in CP and RUP intakes and improved energy status (Table 4). Milk protein yield and milk N:N intake ratio were numerically improved in the current study, perhaps due to the higher protein level supplied for milk protein synthesis in the animals fed higher RUP diets containing CDDGS alone or a mixture of roated-SBM and CDDGS. The economic effect of feeding strategy to improve animal performance is necessary to determine whether the strategy has the potential to be used in practice. Farmers are more willing to apply strategies when the economic effects are remarkably positive. Further calculation showed that although feed cost was increased up to 10.99% in the SB-DG diet (Figure 4), net income over the feed cost was improved 33.85% in this diet as compared to the control diet (Figure 6). The greater income in the animals fed a mixture of roasted SBM and CDDGS substituted for concentrate might relate to higher milk production compared to the control animals. Based on the net income over the feed cost, the price which could have paid for roasted SBM and CDDGS was still made as much profit as with commercial concentrate.

CONCLUSION

The use of CDDGS alone or in combination with medium-roasted SBM as substitute for concentrate in lactating dairy cattle diet led to improve milk production and net income over feed costs without affecting total DMI and milk composition. However, feeding medium-roasted SBM alone seemed to show the intermediate values in almost parameters.

ACKNOWLEDGMENTS

Financial support was provided by the Institute of Research and Development, Suranaree University of Technology, Thailand.

Figure 1
Average weekly dry matter intake of cows during the experiment (ns: not significance). The standard error of the mean is indicated by the error bars over each point. R-SBM, DDGS, and SB-DG are corresponding to medium-roasted soybean meal, dried distiller’s grains with solubles, and medium-roasted SBM+CDDGS replaced for concentrate.
ajas-28-4-519f1.gif
Figure 2
Average weekly milk yield of cows during the experiment (ns, not significance; * p<0.05, ** p<0.01). The standard error of the mean is indicated by the error bars over each point. R-SBM, DDGS, and SB-DG are corresponding to medium-roasted soybean meal, dried distiller’s grains with solubles, and medium-roasted SBM+CDDGS replaced for concentrate.
ajas-28-4-519f2.gif
Figure 3
Average weekly feed efficiency of cows during the experiment (ns, not significance; * p<0.05, ** p<0.01). The standard error of the mean is indicated by the error bars over each point. R-SBM, DDGS, and SB-DG are corresponding to medium-roasted soybean meal, dried distiller’s grains with solubles, and medium-roasted SBM+CDDGS replaced for concentrate.
ajas-28-4-519f3.gif
Figure 4
Average weekly feed cost of cows during the experiment (* p<0.05, ** p<0.01). Costs of raw materials as fresh basis were 0.32, 0.62, 0.47, and $0.05/kg corresponding to concentrate, medium-roasted SBM, CDDGS, and corn silage. The standard error of the mean is indicated by the error bars over each point. R-SBM, DDGS, and SB-DG are corresponding to medium-roasted soybean meal, dried distiller’s grains with solubles, and medium-roasted SBM+CDDGS replaced for concentrate.
ajas-28-4-519f4.gif
Figure 5
Average weekly milk sale money of cows during the experiment (ns, not significance; * p<0.05, ** p<0.01). Milk price was $0.55/kg. The standard error of the mean is indicated by the error bars over each point. R-SBM, DDGS, and SB-DG are corresponding to medium-roasted soybean meal, dried distiller’s grains with solubles, and medium-roasted SBM+CDDGS replaced for concentrate.
ajas-28-4-519f5.gif
Figure 6
Average weekly net income over the feed cost (difference between milk sale money and feed cost) of cows during the experiment (ns, not significance; * p<0.05). The standard error of the mean is indicated by the error bars over each point. R-SBM, DDGS, and SB-DG are corresponding to medium-roasted soybean meal, dried distiller’s grains with solubles, and medium-roasted SBM+CDDGS replaced for concentrate.
ajas-28-4-519f6.gif
Table 1
Chemical composition of individual feeds
Composition (% DM) Experimental feeds

Concentrate1 MR-SBM CDDGS Corn silage
DM 90.49 91.49 88.03 24.02
OM 90.40 92.40 95.07 92.19
CP 21.22 45.34 28.07 9.45
EE 5.13 1.24 6.48 1.49
Ash 9.60 7.60 4.93 7.81
NFC2 22.53 24.98 20.34 17.78
NDF 41.52 20.84 40.18 63.47
ADF 25.35 10.89 20.49 42.21
Lignin (sa) 3.68 1.19 4.13 4.53
NDICP 7.04 1.25 7.52 1.59
ADICP 2.47 0.78 5.34 1.23
DE (Mcal/kg)3 3.28 3.91 3.58 2.63
ME (Mcal/kg)3 2.88 3.50 3.18 2.21
NEL (Mcal/kg)3 1.84 2.28 2.07 1.37

DM, dry matter; MR-SBM, medium-roasted soybean meal (100°C for 180 min using a temperature-controlled mixer); CDDGS, corn dried distillers grains with solubles; OM, organic matter; CP, crude protein; EE, ether extract; NFC, non fiber carbohydrate; NDF, neutral detergent fiber; ADF, acid detergent fiber; NDICP, neutral detergent insoluble crude protein; ADICP, acid detergent insoluble crude protein; DE, digestible energy; ME, metabolizable energy; NEL, net energy for lactation.

1 Contained (as DM basis): 32% cassava distillers dried meal, 20% soybean meal, 17.5% corn distillers dried grains with solubles, 10% rice bran, 10% wheat bran, 8% molasses, and 2.5% mineral plus vitamin mix. Mineral and vitamin mix: provided per kg of concentrate including vitamin A, 5,000 IU; vitamin D3, 2,200 IU; vitamin E, 15 IU; Ca, 8.5 g; P, 6 g; K, 9.5 g; Mg, 2.4 g; Na, 2.1 g; Cl, 3.4 g; S, 3.2 g; Co, 0.16 mg; Cu, 100 mg; I, 1.3 mg; Mn, 64 mg; Zn, 64 mg; Fe, 64 mg; Se, 0.45 mg.

2 Calculated as 100−(CP+NDF+EE+ash).

3 Calculated using published formulas of NRC (2001).

Table 2
Calculated ingredient and chemical composition of experimental treatments
Item (% DM) Treatment1

Control R-SBM DDGS SB-DG
Ingredient composition
 Concentrate 40.00 32.83 28.50 30.67
 Medium roasted SBM - 7.17 - 3.59
 Corn DDGS - - 11.50 5.75
 Corn silage 60.00 60.00 60.00 60.00
Chemical composition
 DM 50.61 50.68 50.33 50.50
 OM 91.47 91.62 92.01 91.81
 CP 14.16 15.89 14.95 15.42
 RDP2 10.31 10.33 9.71 10.02
 RUP2 3.85 5.56 5.23 5.40
 RUP/CP (%) 27.17 35.00 35.00 35.00
 EE 2.95 2.67 3.10 2.88
 Ash 8.53 8.38 7.99 8.19
 NFC 19.68 19.86 19.43 19.64
 NDF 54.69 53.21 54.54 53.87
 ADF 35.47 34.43 34.91 34.67
 Lignin (sa) 4.19 4.01 4.24 4.13
 NDICP 3.77 3.35 3.83 3.59
 ADICP 1.73 1.60 2.06 1.83
 DE (Mcal/kg) 2.89 2.94 2.92 2.93
 ME (Mcal/kg) 2.48 2.52 2.51 2.52
 NEL (Mcal/kg) 1.56 1.59 1.58 1.59

DM, dry matter; SBM, soybean meal; DDGS, dried distiller’s grains with solubles; OM, organic matter; CP, crude protein; RDP, rumen degradable protein; RUP, rumen undegradable protein; EE, ether extract; NFC, non fiber carbohydrate; NDF, neutral detergent fiber; ADF, acid detergent fiber; NDICP, neutral detergent insoluble crude protein; ADICP, acid detergent insoluble crude protein; DE, digestible energy; ME, metabolizable energy; NEL, net energy for lactation.

1 Control: basal diet based on corn silage and concentrate at 27.17% RUP; R-SBM, DDGS, and SB-DG: medium-roasted SBM, CDDGS, and medium-roasted SBM+CDDGS (50:50 based on RUP) replaced for concentrate to meet 35.00% RUP in the diet.

2 Calculated from in situ bag technique (Table 3).

Table 3
In situ degradation kinetics of feeds
Parameters2 Individual feeds1

Concentrate Raw SBM MR-SBM HR-SBM CDDGS Corn silage
Dry matter
 a 47.34 36.54 28.16 24.84 35.57 28.85
 b 44.99 58.93 54.43 54.79 45.22 39.46
 c, per h 0.05 0.07 0.03 0.04 0.04 0.04
 a+b 92.33 95.47 82.59 79.63 80.79 68.31
 ED, at 0.05/h 70.70 70.50 47.70 47.40 54.50 45.10
 RUP (%) 29.30 29.50 52.30 52.60 45.50 44.90
Crude protein
 a 60.08 31.96 20.89 3.97 21.95 56.40
 b 36.15 66.55 68.51 83.55 65.55 23.72
 c, per h 0.05 0.09 0.02 0.02 0.02 0.03
 a+b 96.23 98.51 89.40 87.52 87.50 80.12
 ED, at 0.05/h 77.40 75.40 36.70 29.50 40.00 66.00
 RUP (%) 22.60 24.60 63.30 70.50 60.00 34.00

1 SBM, soybean meal; MR-SBM, medium-roasted SBM (100°C for 180 min using a temperature-controlled mixer); HR-SBM, high-roasted SBM (130°C for 30 min using a tray drying oven); CDDGS, corn dried distillers grains with solubles.

2 In situ degradability; a, the readily soluble fraction (%); b, the fraction potentially degraded in the rumen (%); c, the fractional rate of degradation of b (%); ED, effective degradability (%); k, fractional outflow rate of 0.05/h; RUP, rumen undegradable protein.

Table 4
Intakes and live weight change
Item Treatment1 SEM p-value

Control R-SBM DDGS SB-DG
LW (kg) 392.00 404.42 403.08 404.83 25.39 0.792
LW0.75 (kg) 88.09 90.10 89.94 90.22 4.23 0.797
DM intake (kg/d)
 Total 16.47 16.82 16.98 17.04 0.69 0.272
 Concentrate 6.15a 5.16b 4.53d 4.87c 0.27 <0.001
 SBM 0.00c 1.15a 0.00c 0.56b 0.05 <0.001
 CDDGS 0.00c 0.00c 1.86a 0.96b 0.05 <0.001
 Silage 10.32 10.51 10.59 10.65 0.40 0.208
 Concentrate2 (%) 37.34 37.47 37.62 37.47 0.68 0.744
 Roughage2 (%) 62.66 62.53 62.38 62.53 0.68 0.744
 DMI/LW (g/kg) 42.02 41.80 42.19 42.14 2.35 0.991
 DMI/LW0.75 (g/kg) 186.95 187.04 188.94 188.88 8.57 0.954
CP intake (kg/d)
 Total 2.22b 2.55a 2.44a 2.52a 0.12 <0.001
 Concentrate 1.30a 1.08b 0.85d 1.03c 0.06 <0.001
 SBM 0.00c 0.52a 0.00c 0.26b 0.02 <0.001
 CDDGS 0.00c 0.00c 0.53a 0.27b 0.01 <0.001
 Silage 0.93 0.94 0.95 0.97 0.05 0.343
 CPI/DMI (%) 13.48d 15.15a 14.40c 14.76b 0.27 <0.001
RUP intake (kg/d)
 Total 0.61b 0.90a 0.89a 0.88a 0.04 <0.001
 Concentrate 0.29a 0.25b 0.22d 0.23c 0.01 <0.001
 SBM 0.00c 0.33a 0.00c 0.16b 0.01 <0.001
 CDDGS 0.00c 0.00c 0.31a 0.16b 0.01 <0.001
 Silage 0.31 0.32 0.33 0.33 0.02 0.352
RUPI/CPI (%) 27.35c 35.12b 35.15a 35.13ab 0.06 <0.001
RUPI/DMI (g/kg) 36.88d 53.21a 50.62c 51.85b 0.93 <0.001
RDPI/DMI (g/kg) 109.37 115.51 110.27 113.04 13.34 0.610
NEL intake
 Mcal/d 24.17 24.97 25.70 25.64 1.17 0.062
 Mcal/kg LW0.75 0.27 0.28 0.29 0.28 0.01 0.076
LW change (g/d) 761.90 839.30 815.50 1,011.90 313.39 0.556

SEM, standard error of the mean; LW, live weight; LW0.75, metabolic LW; SBM, soybean meal; CDDGS, corn dried distillers grains with solubles; DMI, dry matter intake; CPI, crude protein intake; RUP, rumen undegradable protein; RUPI, rumen undegradable protein intake; RDPI, rumen degradable protein intake; NEL, net energy for lactation.

1 Control: basal diet based on corn silage and concentrate at 27.17% RUP; R-SBM, DDGS, and SB-DG, medium-roasted SBM, CDDGS, and medium-roasted SBM+CDDGS (50:50 based on RUP) replaced for concentrate to meet 35.00% RUP in the diet.

2 C: concentrate and R: roughage were calculated as percent to total dry matter intakes.

a–d Means within a row with different superscripts are significantly different (p<0.05), n = 24.

Table 5
Milk yield and composition
Item Treatment1 SEM p-value

Control R-SBM DDGS SB-DG
Yield
 Milk (kg/d) 13.47b 14.73ab 16.21a 16.55a 1.56 0.008
 3.5% FCM2 (kg/d) 13.94c 15.02bc 16.73a 16.26ab 1.70 0.006
 ECM3 (Mcal/d) 13.86c 15.01bc 16.61a 16.35ab 1.54 0.004
 Fat (kg/d) 0.51c 0.53bc 0.60a 0.56abc 0.08 0.026
 Protein (kg/d) 0.39c 0.44bc 0.47ab 0.49a 0.04 0.003
 Casein (kg/d) 0.34b 0.37a 0.40a 0.41a 0.03 0.003
 Lactose (kg/d) 0.60b 0.65ab 0.74a 0.75a 0.08 0.019
 Solid-not-fat (kg/d) 1.66c 1.81bc 2.02a 1.99ab 0.18 0.003
 Total solid (kg/d) 1.15c 1.26bc 1.39ab 1.41a 0.13 0.005
Composition
 Fat (%) 3.73 3.66 3.72 3.41 0.56 0.434
 Protein (%) 2.93 2.96 2.90 2.93 0.09 0.584
 Casein (%) 2.50 2.55 2.49 2.46 0.16 0.756
 Lactose (%) 4.42 4.44 4.54 4.51 0.17 0.380
 Solid-not-fat (%) 8.53 8.56 8.59 8.55 0.29 0.973
 Total solid (%) 12.30 12.32 12.48 12.04 0.61 0.422
 Urea N (mg/dL) 18.62 19.59 16.85 18.69 2.59 0.230
 Citric acid (%) 0.16 0.16 0.17 0.16 0.02 0.399
 FFA (mekv/L) 0.58 0.49 0.43 0.43 0.18 0.192
 Acidity (°TH) 16.94 17.84 17.62 17.23 1.19 0.521
Feed efficiency
 Milk/DMI 0.82b 0.87ab 0.96a 0.98a 0.10 0.036
 3.5% FCM/DMI 0.85c 0.89bc 0.99a 0.96ab 0.10 0.021
 Milk ECM/DMI 0.84c 0.89bc 0.98a 0.97ab 0.09 0.013
 Milk ECM/NEL intake 0.58 0.60 0.65 0.64 0.07 0.073
 Milk N4/NI 0.17ab 0.17b 0.19a 0.19a 0.02 0.039

FCM, fat-corrected milk; ECM, energy corrected milk; N, nitrogen; FFA, free fatty acids; mekv: milliequivalents; °TH, Thorner degrees; DMI, dry matter intake; NEL, net energy for lactation; NI, nitrogen intake.

1 Control: basal diet based on corn silage and concentrate (60:40) at 27.35% RUP; R-SBM, DDGS, and SB-DG: medium-roasted SBM, CDDGS, and medium-roasted SBM+CDDGS (50:50 based on RUP) replaced for concentrate to meet 35% RUP in the diet.

2 3.5% FCM = [0.432×milk (kg)]+[16.216×fat (kg)] (Dairy Records Management Systems, 2014).

3 ECM = [0.327×milk (kg/d)]+[12.86×fat (kg/d)]+[7.65×protein (kg/d)], (Peterson et al., 2012).

4 Milk N = milk true protein yield/6.38.

a–c Means within a row with different superscripts are significantly different (p<0.05), n = 24.

REFERENCES

Aguilar-Pérez C, Ku-Vera J, Centurión-Castro F, Garnsworthy PC. 2009. Energy balance, milk production and reproduction in grazing crossbred cows in the tropics with and without cereal supplementation. Livest Sci 122:227–233.
crossref
Alexandratos N, Bruinsma J. 2012. World agriculture towards 2030/2050. ESA Working paper No. 12–03. FAO; Rome, Italy:

Anderson JL, Schingoethe DJ, Kalscheur KF, Hippen AR. 2006. Evaluation of dried and wet distillers grains included at two concentrations in the diets of lactating dairy cows. J Dairy Sci 89:3133–3142.
crossref pmid
AOAC. 1998. Official Method of Analysis. 16th ednAssociation of Official Analytical Chemists, International; Washington, DC, USA:

Boucher SE, Ordway RS, Whitehouse NL, Lundy FP, Kononoff PJ, Schwab CG. 2007. Effect of incremental urea supplementation of a conventional corn silage-based diet on ruminal ammonia concentration and synthesis of microbial protein. J Dairy Sci 90:5619–5633.
crossref pmid
Castillo-Lopez E, Klopfenstein TJ, Fernando SC, Kononoff PJ. 2013. In vivo determination of rumen undegradable protein of dried distillers grains with solubles and evaluation of duodenal microbial crude protein flow. J Anim Sci 91:924–934.
crossref pmid
Chen XB. 1996. An excel application programme for processing feed digestibility data. User Manual. Rowett Research Institute; Bucksburn, Aberdeen, UK:

Chingala G, Mtimuni JP, Msiska H, Gondwe T, Chigwa FC. 2013. Milk production performance of Friesian-Holstein cows fed diets containing Medicago sativa, Centrosema pubescens, or groundnut haulms (Arachis hypogaea). Trop Anim Health Prod 45:1485–1488.
crossref pmid
Dairy Records Management Systems. DHI Glossary. http://www.drms.org/PDF/materials/glossary.pdfAccessed April Date, 2014

Fathi Nasri MH, France J, Mesgaran MD, Kebreab E. 2008. Effect of heat processing on ruminal degradability and intestinal disappearance of nitrogen and amino acids in Iranian whole soybean. Livest Sci 113:43–51.
crossref
Gehman AM, Kononoff PJ. 2010. Nitrogen utilization, nutrient digestibility, and excretion of purine derivatives in dairy cattle consuming rations containing corn milling co-products. J Dairy Sci 93:3641–3651.
crossref pmid
Goelema JO. 1999. Processing of Legume Seeds: Effect on Digestive Behaviour in Dairy Cows. PhD Thesis. Wageningen Agricultural University, City; The Netherlands:

Hristov AN, Hanigan M, Cole A, Todd R, McAllister TA, Ndegwa PM, Rotz A. 2011. Ammonia emissions from dairy farms and beef feedlots: A review. Can J Anim Sci 91:1–35.
crossref
Janicek BN, Kononoff PJ, Gehman AM, Doane PH. 2008. The effect of feeding dried distillers grains plus solubles on milk production and excretion of urinary purine derivatives. J Dairy Sci 91:3544–3553.
crossref pmid
Kelzer JM, Kononoff PJ, Tedeschi LO, Jenkins TC, Karges K, Gibson ML. 2010. Evaluation of protein fractionation and ruminal and intestinal digestibility of corn milling co-products. J Dairy Sci 93:2803–2815.
crossref pmid
Kleinschmit DH, Anderson JL, Schingoethe DJ, Kalscheur KF, Hippen AR. 2007. Ruminal and intestinal degradability of distillers grains plus solubles varies by source. J Dairy Sci 90:2909–2918.
crossref pmid
Masoero F, Pulimeno AM, Rossi F. 2005. Effect of extrusion, expansion and toasting on the nutritional value of peas, faba beans and lupins. Ital J Anim Sci 4:177–189.
crossref
NRC. 2001. Nutrient Requirements of Dairy Cattle. 7th. Rev. EdNational Academy Press; Washington DC, USA:

Ørskov ER, McDonald I. 1979. The estimation of protein degradability in the rumen from incubation measurements weighted according to rate of passage. J Agric Sci Camb 92:499–503.
crossref
Peterson S, Rezamand P, Williams JE, Price W, Chanine M, McGuire MA. 2012. Effects of dietary betaine on milk yield and milk composition of mid-lactation Holstein dairy cows. J Dairy Sci 95:6557–6562.
crossref pmid
SAS. 2002. SAS software User’s Guide: Version 9.0. SAS Institute Inc; Cary, NC, USA:

Schingoethe DJ, Kalscheur KF, Hippen AR, Garcia AD. 2009. Invited review: The use of distillers products in dairy cattle diets. J Dairy Sci 92:5802–5813.
crossref pmid
Shaver RD, Nytes AJ, Satter LD, Jorgensen NA. 1986. Influence of amount of feed intake and forage physical form on digestion and passage of prebloom alfalfa hay in dairy cows. J Dairy Sci 69:1545–1559.
crossref
Sirohi SK, Walli TK, Mohanta RK. 2011. Comparative evaluation of raw and roasted soybean in lactating crossbred cows. Trop Anim Health Prod 43:725–731.
crossref pmid
US EPA. 2011. Reactive nitrogen in the United States: An analysis of inputs, flows, consequences, and management options. A report of the EPA science advisory board (EPA-SAB-11-013). EPA; Washington, DC, USA:

Van Soest PJ, Robertson JB, Lewis BA. 1991. Methods for dietary fiber, neutral detergent fiber, and nonstarch polysaccharides in relation to animal nutrition. J Dairy Sci 74:3583–3597.
crossref pmid
Wanapat M, Pilajun R, Rowlinson P. 2013. Effect of carbohydrate source and cottonseed meal level in the concentrate: IV. Feed intake, rumen fermentation and milk production in milking cows. Trop Anim Health Prod 45:447–453.
crossref pmid
Woods VB, Moloney AP, O’Mara FP. 2002. The in situ ruminal degradability of concentrate feedstuffs in steers as affected by level of feed consumption and ratio of grass silage to concentrate. Anim Feed Sci Technol 100:15–30.
crossref
TOOLS
METRICS Graph View
  • 6 Crossref
  • 11 Scopus
  • 10,336 View
  • 154 Download
Related articles


Editorial Office
Asian-Australasian Association of Animal Production Societies(AAAP)
Room 708 Sammo Sporex, 23, Sillim-ro 59-gil, Gwanak-gu, Seoul 08776, Korea   
TEL : +82-2-888-6558    FAX : +82-2-888-6559   
E-mail : editor@animbiosci.org               

Copyright © 2024 by Asian-Australasian Association of Animal Production Societies.

Developed in M2PI

Close layer
prev next