


INTRODUCTION
Milk production ability is one of the most important traits in dairy cattle. Milk, milk fat, and milk protein yields are quantitative traits that are not affected by one chromosome or a small number of loci. Therefore, it is desirable to detect genetic variation that is effective for the expression of traits using high density genome-wide significant single nucleotide polymorphism (SNP) rather than to study minor genetic variation by candidate gene approach (Liu and Dekkers, 1998). Recently, with the advent of genome-wide panels of SNPs chips it became easier to explore quantitative trait loci (QTL) and SNPs associated QTL. Several genome wide association studies have been conducted using SNP chips in dairy cattle (Pryce et al., 2010; Jiang et al., 2010; Mai et al., 2010; Guo et al., 2012).
Because of the variations in milk yields by lactation, the genetic performance of dairy cattle is tested using a multiple lactation model utilizing different lactation records which are considered as different traits (Jamrozik et al., 1997). The first lactation in cows is affected by growth performance and nutrient distribution mechanism, and consequently genes associated with milk yield vary by lactation. The multiple lactation model can be indirect evidence since SNP association analysis varies at different lactations. Therefore, significant SNPs common to all lactations can be pure SNPs associated with milk production which are not affected by outside environment.
In this experiment a genome wide association study was conducted using estimated breeding value (EBV) for milk production traits from 1st to 4th lactation; significant SNPs were selected for each trait and compared the differences by lactation.
MATERIALS AND METHODS
DNA sampling and data collection
To investigate high density genome-wide genotype, DNA samples were taken from 456 animals which are Holstein proven bulls whose semens are being sold or the daughters of old proven bulls whose semens are not being sold in Korea. The EBVs of all genotyped animals for milk, fat, and protein yields were also collected by lactation. Phenotypes from 1st to 4th lactation were considered as different traits and genetic (co)variances between lactations were considered to model an equation for breeding value estimation.
Estimated breeding value as the dependent variable of association test
The EBVs of all genotyped animals by lactation which were used as the dependent variable of marker association test were estimated using single trait-multiple lactation model.
Where,
y is 305-day adjusted milk, milk fat, milk protein
hyi is ith herd-year effect
agj is jth age group effect of delivery age
ak is animal genetic effect as a random effect
eijk is residual error.
l is lactation number (1 to 4)
Breeding value of 464,216 individuals were estimated and selected for 456 genotyped individuals.
Genotyping and quality control
Genomic DNA was extracted from samples and chip analysis was performed using Illumine Bovine SNP50 v2. Using Genome Studio program, genotypes of 54,609 SNPs were investigated. Then SNPs with more than 10% missing genotype rate, with less than 1% of minor allele frequency and with Hardy-Weinberg Disequilibrium (p<0.000001), SNPs on sex chromosome, and SNPs without position information were deleted and were not used in this experiment. The remaining missing genotypes were imputed using BEAGLE program (Browning and Browning, 2007), and imputation results were tested again with above standards. As the results of quality control of SNP information, 41,050 SNPs were used for the analysis.
Statistical analysis
Genome wide association test was performed using single marker regression.
Where,
y is the EBV for milk yields, milk fat and protein yields of animals with all genetic information,
μ is mean effect of a SNP
b is the regression coefficient of EBV on SNP genotype,
x is allele code substituted minor homozygote, heterozygote and major homozygote with 0, 1 and 2, respectively,
e is residual error.
Significance for SNP association with traits was tested using F-test and significance level was corrected using Bonferroni correction. For all SNPs correlation coefficients for each estimated effect by lactation were calculated, and mean deviation and standard deviation by lactation were calculated and compared using the standardized SNP effects.
RESULTS AND DISCUSSION
Significant single nucleotide polymorphisms for milk production traits
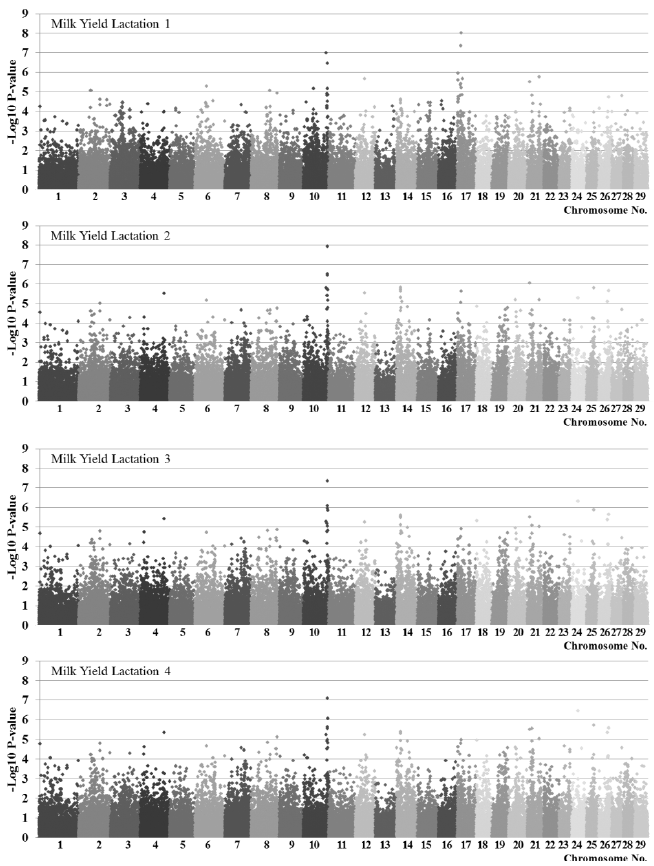
Results of association analysis by trait using F-test are shown in Figure 1 (Figure 1 is for milk yield and Supplementary Figure S1, S2 are for fat yield and protein yield, respectively). It was observed that many SNPs had genome-wide effects and SNP frequency decreased sharply as significance level increased (Table 1). At the same significance level (1.22×10⁻⁶ same as Bonferroni corrected p-value<0.05) more SNPs were detected in the order of milk protein yields, milk fat yields, and milk yields. There were similar number of significant SNPs in milk yields and milk protein yields by lactation, however, more SNPs were detected in first lactation than in second to fourth lactation for milk fat yields. For milk yields, 10 significant SNPs located on chromosomes 10, 17, 21, and 24 were detected at least in one lactation. Thirteen SNPs located on chromosomes 2, 16, 19, and 21 for milk fat while milk protein had 28 SNPs located on chromosomes 1, 2, 3, 6, 8, 9, 12, 14, 17, 21, 24, and 28 which showed genome-wide distribution.
Some of the significant SNPs in one trait were also detected in different traits. Three SNPs BTB-01440888, ARS-BFGL-NGS-22135, and ARS-BFGL-NGS-101670 were significantly associated in both milk yield and milk protein yield trait (Table 2 and Supplementary Table S2). And another three SNPs, BTB-01536920, ARS-BFGL-NGS-35056 and ARS-BFGL-NGS-21956, were significantly associated in both milk fat yield and milk protein yield trait (Supplementary Tables S1 and S2). For milk protein yields, significant SNPs common to all other traits were detected, while there were no significant SNPs common to milk yields and milk fat yields.
Some of the researchers reported highly significant SNPs on Chromosome 14 which differs from our results (Jiang, 2010; Pryce et al., 2010; Meredith et al., 2012; Minozzi et al., 2013), while other researchers reported that there was no significant SNPs on Chromosome 14 for other breeds (Mai, 2010; Guo et al., 2012). Also there is the tendency to find significant SNPs from a causal variant in Chromosome 14 (Hayes et al., 2010).
Difference of significant single nucleotide polymorphisms by lactation
There were significant SNPs that may have effects on all lactation. That is, for milk yields, BTB-01901596 in BTA10, for milk fat ARS-BFGL-NGS-95316 in BTA2, and for milk protein ARS-BFGL-NGS-53141 and ARS-BFGL-NGS-35056 in BTA2, ARS-BFGL-NGS-103603, ARS-BFGL-BAC-33343, ARS-BFGL-NGS-11578, ARS-BFGL-NGS-56762 and BTA-51937-no-rs in BTA21, and BTA-20879-no-rs in BTA28. However, most of the significant SNPs had different effects in first and subsequent lactation (Table 2, Supplementary Tables S1 and S2). As their effect varies especially between first lactation and posterior lactation, it indicates the different genetic mechanism for milk production yields in first lactation and posterior different lactation. The same trends were noted in mean deviation of standardized effects and correlation (Table 3). The difference of mean deviation between first and subsequent lactation was the largest and correlation was relatively low. This result shows similar pattern to the result that genetic correlation is higher between second and third lactation than between first and second lactation using multiple lactation model (Liu et al., 2002). For standard deviation of estimated SNP effects by lactation, since the SNPs with large values of standard deviation by lactation showed genome-wide distribution (Figure 2), many genes differently express effects by lactation. And these may be candidate genes associated with genes affecting the deviation of milk production yields by lactation.
CONCLUSION
In conclusion, since the genes associated with each breeding value had different effects at different lactation period, a multi-lactation model in which lactation is considered as different traits can be genetically ideal for the analysis of lactation traits. Also, significant genetic markers for all lactations and markers which are common to all milk production traits at different traits were detected. These can be utilized for QTL exploration and marker assisted selection in milk production traits.

 PDF Links
 PubReader
 ePub Link
 Full text via DOI
 Full text via PMC
 Download Citation
 Print
Print


